Assessment of Dose Distributions According to Low Magnetic Field Effect for Prostate SABR
Article information
Abstract
Background
Stereotactic ablative radiotherapy (SABR) plans in prostate cancer are compared and analyzed to investigate the low magnetic effect (0.35 T) on the dose distribution, with various dosimetric parameters according to low magnetic field.
Materials and Methods
Twenty patients who received a 36.25 Gy in five fractions using the MR-IGRT system (ViewRay) were studied. For planning target volume (PTV), the point mean dose (Dmean), maximum dose (Dmax), minimum dose (Dmin) and volumes receiving 100% (V100%), 95% (V95%), and 90% (V90%) of the total dose. For organs-at-risk (OARs), the differences compared using Dmax, V50%, V80%, V90%, and V100% of the rectum; Dmax, V50%, V30Gy, V100% of the bladder; and V30Gy of both left and right femoral heads. For both the outer and inner shells near the skin, Dmean, Dmin, and Dmax were compared.
Results and Discussion
In PTV analysis, the maximum difference in volumes (V100%, V95%, and V90%) according to low magnetic field was 0.54±0.63% in V100%. For OAR, there was no significant difference of dose distribution on account of the low magnetic field. In results of the shells, although there were no noticeable differences in dose distribution, the average difference of dose distribution for the outer shell was 1.28±1.08 Gy for Dmax.
Conclusion
In the PTV and OARs for prostate cancer, there are no statistically-significant differences between the plan calculated with and without a magnetic field. However, we confirm that the dose distribution significantly increases near the body shell when a magnetic field is applied.
Introduction
The global incidence of prostate cancer is estimated to be over 900,000 men [1]. The solutions of localized prostate cancer treatment are various methods such as surgery, radiotherapy and brachytherapy. It is reported that radiotherapy has the most benefit of improvement for distant-metastatic free survival, biochemical disease-free survival (bDFS) and overall survival (OS) in these treatment techniques [2]. Stereotactic ablative radiotherapy (SABR) has been introduced as a representative treatment delivering with a single or few fraction(s) compared with conventional fractions, using daily dose (7.25 Gy) to a total dose of 36.25 Gy for localized prostate cancer [3]. Many studies indicate that the clinical benefits of treating prostate cancer patients with SABR are that it is faster, low toxicity, and better than conventional fractionated radiotherapy [4–6]. These can be explained by the α/β ratio of clinically-interesting terms, which explains the cell survival-dose response curve. In particular, prostate cancer, as a late responding tissue, has a lower α/β ratio, making the curve more bendy and more resistant to low doses, therefore, a higher single dose can be beneficial [7–10]. Additionally, sensitivity is expected to increase if the lower dose per fraction is reduced. Hence, SABR has recently been stimulated for prostate cancer in contrast to conventionally-fractionated radiotherapy.
However, there is still a significant problem of high dose per fraction: the side effects remain, regardless of beam delivery by smaller dose fractions. Therefore, more attention must be given to this SABR technique as it can geometrically change the critical organs if rectum gas is present or if there is urine in the bladder. It may also cause complications regarding toxicity as well as tumor control. In response to these issues, newly developed machinery and tools for increasing the geometric accuracy have been introduced in recent years. In our clinic, we have been used a ViewRay (ViewRay Inc., Cleveland, OH, USA) to improve an accuracy of the geometric alignment and clinical [11–13]. ViewRay comprises a 0.35 tesla (T) low-magnetic imaging system and three 60Co sources. A recently developed ViewRay can acquire images in real-time and treat; thus, it can be used for tissues in which many deformations occur, like the prostate.
However, ViewRay has drawbacks due to the magnetic field: General studies have reported that the strength of magnetic field cause difference of the depth dose and lateral shift of the photon’s dose distribution, also called the electron return effect (ERE), by using the geometrics of this system [14, 15]. Raaijmakers et al. [16] founded that the ERE increase 40% dose enhancement at beam exit region of the phantom. In addition, A.D. Esmaeeli et al. [17] has been reported that the effects on dose distribution caused with magnetic field (1.5 T, 3 T) for breast plans.
On the basis of these results, we investigate the variation of dose distribution for a low magnetic field to verify the ERE resulting in dose enhancement or reduction for localized prostate cancer (SABR plans).
Materials and Methods
1. Treatment system (ViewRay)
The treatment system consists of two parts: an onboard imaging system using MRI and a radiation therapy system. MR imaging system uses a 0.35 T magnetic field and treatment parts is made up with three 60Co sources and three multi-leaf collimators (MLC) that is mounted 120° apart and generated 550 cGy·min−1 (max), designed for minimizing the penumbra that the distance from the source to MLC is at least 50 cm. MLC has 1.05 cm resolution at the isocenter distance of 105 cm and is working in a step-and-shoot mode. There is each leaf having 60 leaves and interval gap is 0.5 cm, which offers a maximum field of 27.3×27.3 cm2
2. Description of prostate plans
The clinical treatment plans for the 20 prostate cancer patients, approved by the IRB (H-1607-047-774), were designed to use the SABR technique delivering total dose of 36.25 Gy (5 fractions). All patients who treated between October 2015 and April 2018 were selected.
The PTV includes a margin which is added to the CTV in the three dimensions to compensate for the available probability of clinical uncertainties. The average volume of the PTV is 81.3±26.6 cm3 (39.0–138.8 cm3). Several OARs were contoured: the rectum, the bladder, and the left and right femoral heads. Both outer and inner shells, near the skin outlines of the patients, were created to investigate the difference on dosimetric parameters according to the low magnetic field. The two shell structures including the outer shell and the inner shell had a thickness of ±0.3 cm at the center of the skin surface.
We used the treatment planning system produced by ViewRay, which is known as novel software based on Monte Carlo (MC) calculation algorithms. We set the optimization of 1.0 for smoothing and the level parameter of 3.0 for discretizing fluence map. It was calculated using MC algorithms, deemed to be the leading algorithms for accurate dose calculations with electrons. The results of the dose distributions with and without a magnetic field were generated, respectively, for the prostate cancer patients.
3. Statistics Analysis
SPSS 23.0 (SPSS Inc., Chicago, IL, USA) statistical software was employed for the analysis. The paired t test was used to compare the dose difference with/without low magnetic field. Data are presented as mean±standard deviation (SD). In all analyses, a two-sided p-value <0.05 was considered statistically significant.
4. Plan evaluation by various parameters
Dose volume histograms (DVHs) were analyzed by dosimetric parameters for evaluating the effect on the dosimetric parameters with the low magnetic field. The DVH results were analyzed for each patient. For the PTV, we analyzed Dmean, Dmin, Dmax, and volumes receiving 100% (V100%), 95% (V95%), and 90% (V90%) of the total dose. The OARs used in clinical treatment planning may be compared using the Dmax, V50%, V80%, V90%, and V100% of the rectum; the Dmax, V50%, V30Gy, and V100% of the bladder; and the V15Gy and V30Gy of the left and right femoral heads, respectively. For both shells, we also analyzed Dmean, Dmin, Dmax, respectively.
Results
A comparison of the dose distribution with and without the magnetic field is shown in Figure 1.
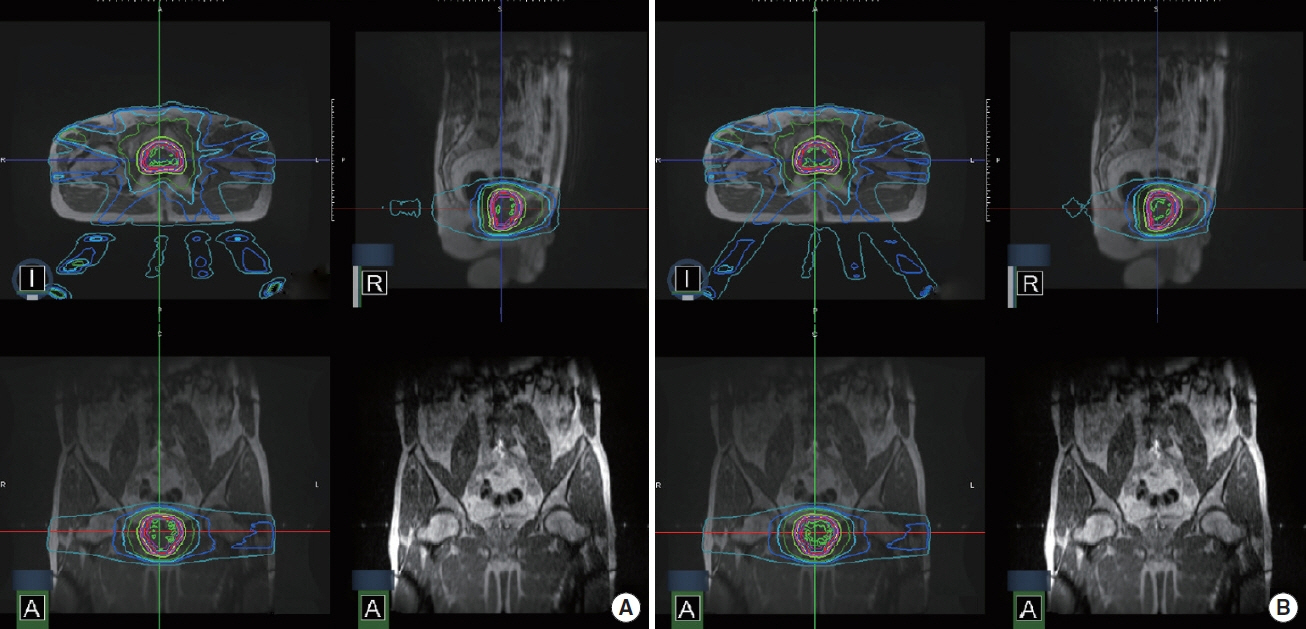
An example of dose distributions (A) with a magnetic field (B0), (B) without a magnetic field for prostate cancer SABR.
1. The difference of dose distribution in PTV
The results were calculated based on the presence or absence of magnetic field for the PTV. We analyzed the dose value at the Dmean, Dmin, and Dmax volumes, receiving V100%, V95%, and V90% of the total dose, as shown in Figure 2. Table 1 analyzed the difference of the average dose and volume for PTV. For the PTV, the average differences of dosimetric values at the Dmean, Dmax, and Dmin were 0.05±0.04 Gy (p=0.33), 0.25±0.24 Gy (p=0.45), and 0.26±0.17 Gy (p=0.33), respectively. Furthermore, the average differences of the V100%, V95%, and V90% for the PTVs were less than 1%. This confirms that the low magnetic field does not impact the dosimetric values for the PTV.
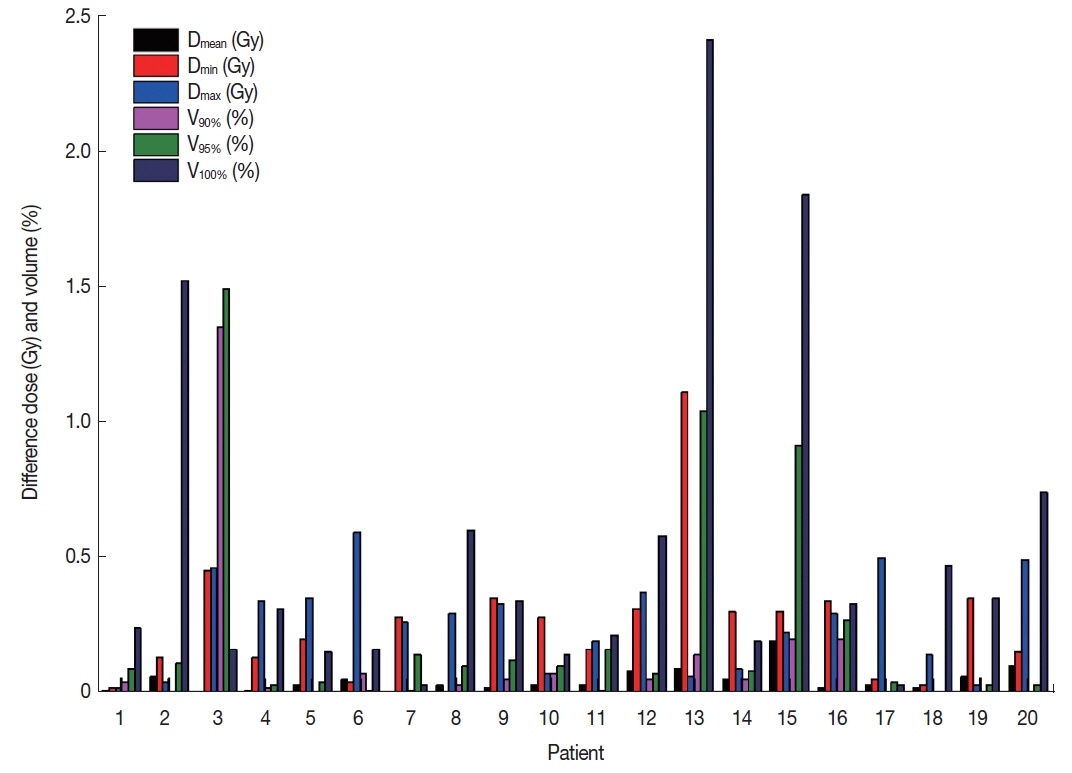
The difference of volume and dose in PTV for each patient.
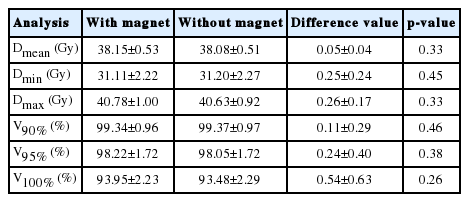
The Comparison of Dosimetric Parameters for PTV
2. The difference of dose distribution in OARs
Table 2 displays results of the average dose volume differences for OARs, including the rectum, bladder, and left and right femoral heads. The average differences of the Dmax, V50%, V80%, V90%, and V100% were 0.32±0.32 Gy (p=0.36), 0.42± 0.59% (p=0.48), 0.26±0.20% (p=0.46), 0.22±0.25% (p= 0.44), and 0.26±0.45% (p=0.33), respectively, in the rectum. The average differences of the dosimetric parameters for the bladder were 0.30±0.20 Gy (p=0.49) at Dmax, 0.15±0.19% (p=0.50) at V50%, 0.25±0.54% (p=0.48) at V30Gy, and 0.20± 0.23% (p=0.48) at V100Gy. For both femoral heads, the V10Gy and V15Gy were examined. The average differences of V10Gy and V15Gy were 0.65±0.59% (p=0.48) and 0.32±0.34% (p=0.50) in the left femoral head. In the same manner, there was no significant difference in the right femoral head.

The Comparison of Dosimetric Parameters for OARs
3. The difference of dose distribution near the skin
Figure 3 shows the dose distribution in sagittal images for the effect of the magnetic field. Table 3 shows the results of the average dose difference of Dmean, Dmin, and Dmax for the both shell structures. For the outer and inner shells, the average dose differences of minimum and mean dose values were smaller than 1 Gy. Meanwhile, the deviation of the average difference at the outer shell, with a value of 1.28±1.08 Gy (p=0.03), can be confirmed for the Dmax. The p-value for the Dmax was less than 0.05. The results imply that there is a slight dose difference in the outer shell.
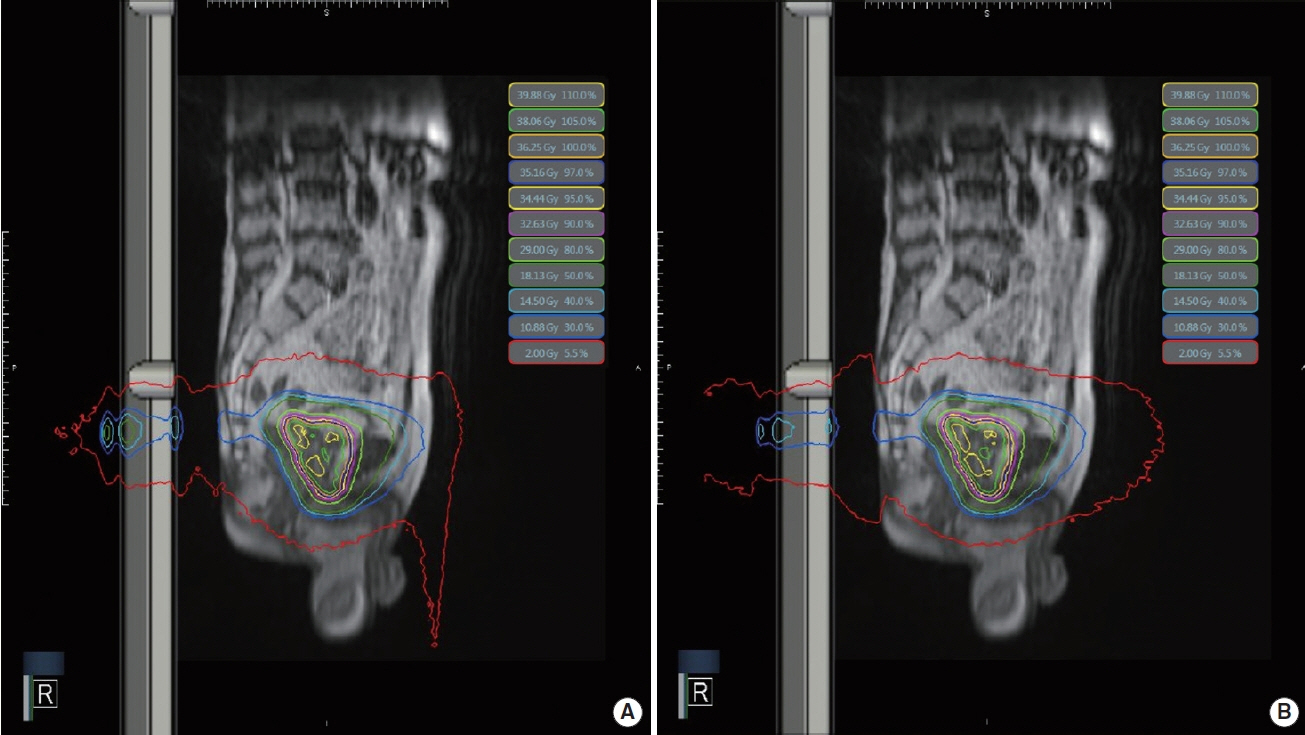
An example of dose distributions in a sagittal image: (A) with a magnetic field (B0), (B) without a magnetic field.
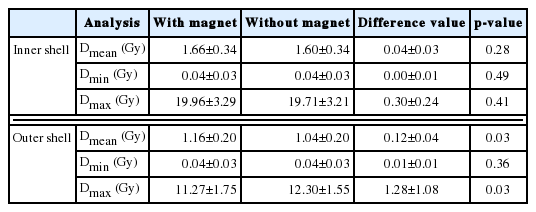
The Comparison of Dosimetric Parameters for Outer and Inner Shells
Discussion
From the results, we confirm the dose distribution changes resulting from electron return effect (ERE): it can be neglected on the PTV, but it can significantly increase the dose on the outside the body for SABR plans with prostate cancer. These results indicate that it entails further study on the effect of the low magnetic field regarding other treatment sites, techniques. That is, whether a low magnetic field is valid for dose distribution by photons for other treatment methods remains a question. To evaluate the treatment plans, plans with/without magnetic field were calculated by MC algorithms, respectively. They are applied the same techniques such as variance reduction to maintain a high performance for the optimized simulation of photons. The MC algorithm calculated for the dose distributions without magnetic fields was considered the geometry information by the only photon. However, the MC algorithm calculated for the dose distributions with a magnetic field was considered the geometry information by the secondary electrons created by photons. They may be bent by the Lorentz forces and have arc-shaped trajectories in tissue or water, making physical changes such as build- up reduction and increasing of dose and penumbra. For this reason, it has the problem magnetic field could cause the dose distribution change in the body. Moreover, there is potential for the occurrence of an increased or decreased dose distribution up to 7% or 12% near the surface, respectively, and, therefore, the increased dose to the internal and contralateral tissue and PTV can be reduced due to the magnetic field, according to A.D. Esmaeeli’s studies [17]. In contrast, we have verified that the low magnetic field increases the dose especially in the vicinity of a body surface in former researches [18, 19]. On PTV and internal tissues, they may not change dose distribution with magnetic field compared to that without magnetic field in breast and liver cancer. However, on the outside of the body, as mentioned, it has a slight dose increase because of the ERE. Moreover, it may be more likely to occur re-build up especially in air. Therefore, it necessary to investigate further studies on the dose distribution with magnetic field for tissues composed of air, such as the lung, and not for internal tissue.
Conclusion
There is no significant observation of the dose distribution with a low magnetic field for the PTV and OARs in SABR plans. However, there were appreciable dose distribution changes outside the body owing to the production of secondary electrons or scatter radiation being taken from treatment head parts.
Acknowledgements
This work was supported by the National Research Foundation of Korea (NRF) grant funded by the Korea government (MSIP) (NRF-2017M2A2A7A0202640), (NRF-2017M-2A2A7A0202643) and (NRF-2017M2A2A7A0202641).