Dissociation of Thymine by Low-Energy Electrons
Article information
Abstract
Background
There have been various studies to investigate the mechanisms of DNA damage from low-energy electrons. To understand the mechanism of these strand breaks, it is necessary to investigate the dissociation mechanism of the DNA constituents, that is, bases, sugars, and phosphates.
Materials and Methods
We studied the dissociation of thymine base upon interaction with low-energy electrons. For this experiment, thymine powder was pressed onto the indium base and irradiated by 5 eV electrons.
Results and Discussion
Non-irradiated and irradiated thymine samples were compared and analyzed using the X-ray photoelectron spectroscopic technique to analyze the dissociation patterns of the molecular bonds after low-energy electron irradiation of thymine.
Conclusion
With 5 eV electron irradiation, C-C and N-C=O bonds are the primary dissociations that occur in thymine molecules.
Introduction
In year 2000, Sanche group [1, 2] reported that low-energy electrons (LEE) with sub-ionization energy of DNA could interact with DNA and cause single strand breaks (SSB) and/or double strand breaks (DSB) to DNA. In their results, SSB was observed as low as at 3-eV incident-electron energy. Since this report, Sanche and other researchers [3–9] has pioneered the investigation of DNA damage induced by LEE irradiation and explained the observation of DNA damage with dissociative electron attachment (DEA) process. DEA occurs when a free unbound electron attaches to a molecule to form a temporary negative ion, then dissociates into a negative ion and a neutral fragment [3, 4]:
Primary high-energy radiations interacting with biomolecules generate secondary species such as radicals, ions and LEEs along the radiation track through the local energy deposition to the targets. Most of LEEs in this energy region do not have energies enough to directly ionize DNA molecules [10]. But these secondary LEEs in vivo can subsequently react with DNAs and their constituents, such as bases, sugar and phosphate, and lead to various DNA damages indirectly [1, 11]. Therefore, the fundamental understanding of the interactions of LEEs with DNA constituents is very important to understand indirect DNA damages, which are comparable to direct DNA damages by high-energy radiations.
For understanding of indirect DNA damage by LEEs, Sanche [2] has studied the simple DNA components like nucleobase, deoxyribose analogues, phosphate analogues and more complex targets like oligomer and plasmid DNA. Since then, there have been many experimental and theoretical studies reported on the mechanisms of DNA damage by the DEA process [2, 10, 12–14]. In these studies, the gel electrophoresis technique and mass spectroscopic methods have been the ones commonly used in analyzing and quantifying the dissociations and the subsequent damages to the molecules. However, each technique has its own advantage(s) and disadvantage(s). For example, in case of the gel electrophoresis technique, we cannot tell which bonds of DNA are broken and what kind of fragments are produced from the damages. Mass spectrometry gives us the information about the dissociation products, but the neutral dissociation products have to be ionized to be detected which could disturb the dissociation processes. Therefore, to fully understand the damage processes, various different techniques have to be employed complementarily.
In this report, we studied the dissociation of thymine by LEEs using X-ray photoelectron spectroscopy (XPS) for analyzing the bond cleavage in thymine with and without LEE irradiation. To better understand DNA damage by LEEs, we have to understand how its constituents, such as the nucleobases including thymine, dissociate upon interactions with LEEs. Thymine is chosen more or less arbitrarily as our target among four nucleobases. XPS has an advantage of studying the dissociation without ionizing the dissociation products, but not gives the details of dissociation products.
Materials and Methods
Thymine was purchased, in a powder form, from Sigma-Aldrich Chemical Co., St. Louis, MO, USA and used as received without further purification. The thymine powder was pressed into the surface of the indium disks to make the thymine samples for electron irradiation and XPS analysis. Since indium is very pliable metal, the thymine powder was easily charged into the metal. Indium was purchased from Aesa, Haverhill, MA, USA. Small pieces of indium shot, with a radius of about 5 mm, were cut into a disk shape, and the thymine powder was deposited onto the surface of the indium disks.
Thymine samples were prepared and loaded into the main vacuum chamber for LEE irradiation. An experimental setup for LEE irradiation consists of a homemade electron gun, a Faraday cup, and a sample holder. The sample holder can rotate to irradiate each thymine sample separately. Each sample was irradiated by 5-eV LEE for 5 minutes. When one sample was being irradiated, the others were applied with the repelling potential of 9 V to avoid any effects from the stray LEEs. The irradiation of thymine was carried out under the ultra high vacuum (UHV) condition, approximately 10−10 torr, pumped by a turbomolecular pump.
After electron irradiation, the samples were loaded onto the XPS, together with the un-irradiated samples for comparison, and were analyzed. We used Thermo MultiLab 2000 XPS system (Thermo Fisher Scientific, Waltham, MA, USA) at the Center for Research Facility of Chungnam National University. This system was equipped with an Mg/Al dual anode beam source, a concentric hemispherical analyzer, and a Channeltron detector (Photonis, Merignac, France). The Mg Kα source (1,253.6 eV) was used for the experiment, and the power and the base pressure were maintained at 150 W and 4×10⁻¹⁰ torr, respectively. XPS spectral resolution was about 0.7 eV, as estimated from the full width at half maximum of the Ag 3d5/2 spectrum. The angle of incidence of the X-ray beam with the sample normal was 45° and the analyzer was positioned normal to the target surface. XPS spectra were recorded in the fixed analyzer transmission mode with energy steps of 0.1 eV.
In this study, we examined the changes in the XPS spectra between the 5-eV electron-irradiated and the un-irradiated samples. And from these changes, we have derived the possible bond dissociations in thymine.
Results and Discussion
XPS is a quantitative spectroscopic technique that measures the composition and the electronic states of the elements of the target material (for the details of XPS, please refer the reference [15]). From this information, we could tell the binding energy of the electron ejected from an atom which was bonded to other atoms. When an atom makes a bond with other atoms, its valence electrons are involved in the bonding and their electronic states are changed, which subsequently affect the binding energies of the core electrons. Therefore, a carbon atom, for example, could have different C1s binding energies depending on what kind of bonding it makes with what kind of atoms. This energy shift in the binding energy is called the “chemical shift”. By exploiting this chemical shift, we could tell that what kind of chemical bonding the detected electron came from [15]. Fig. 1 is an example of survey spectrum of an irradiated thymine sample, showing the photoelectron peaks from C1s, N1s, and O1s. Thymine contains hydrogen atom as well, but photoelectron peak from hydrogen atom is not observed in this survey scan, because it can hardly be observed by XPS, as well known. More detailed C1s, N1s, and O1s spectra were scanned for both the un-irradiated and the irradiated thymine targets to confirm the possible damages caused by electron irradiation. Fig. 2A is a C1s spectrum for the thymine without electron beam irradiation and Fig. 2B is a spectrum for the thymine with 5-eV electron-beam irradiation. For a single C1s spectrum, there could be several different contributions from the ejected photoelectrons with slightly different binding energies depending on different bonding of the carbon atoms due to the chemical shifts. Typical bonding of carbon atoms are hydrocarbon bond [C-H, C-C], carbon bond to nitrogen [C-N, N-C-N], amide bond [N-C=O], urea bond [N-C(=O)-N], and others. Binding energies of C1s in these bonds are different from each other and the values are available from the studies [16–18] and summarized in Table 1.
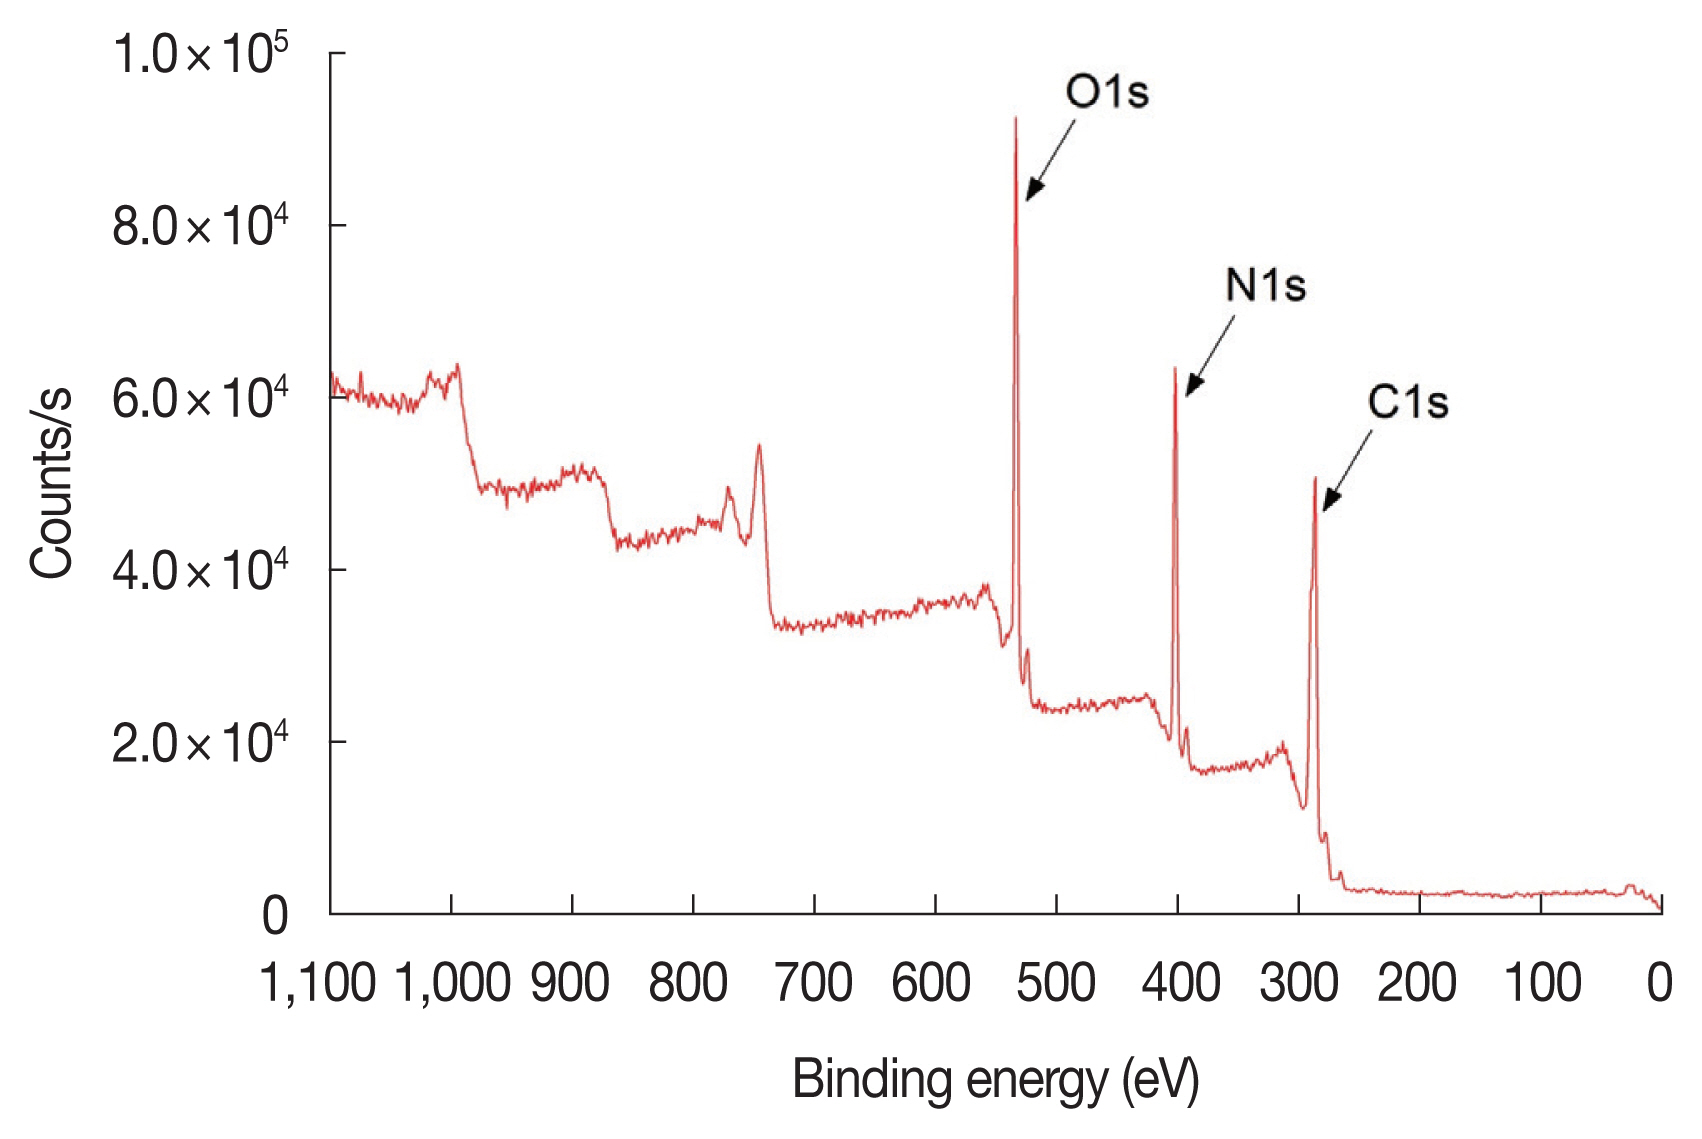
X-ray photoelectron spectroscopy survey spectrum of thymine.
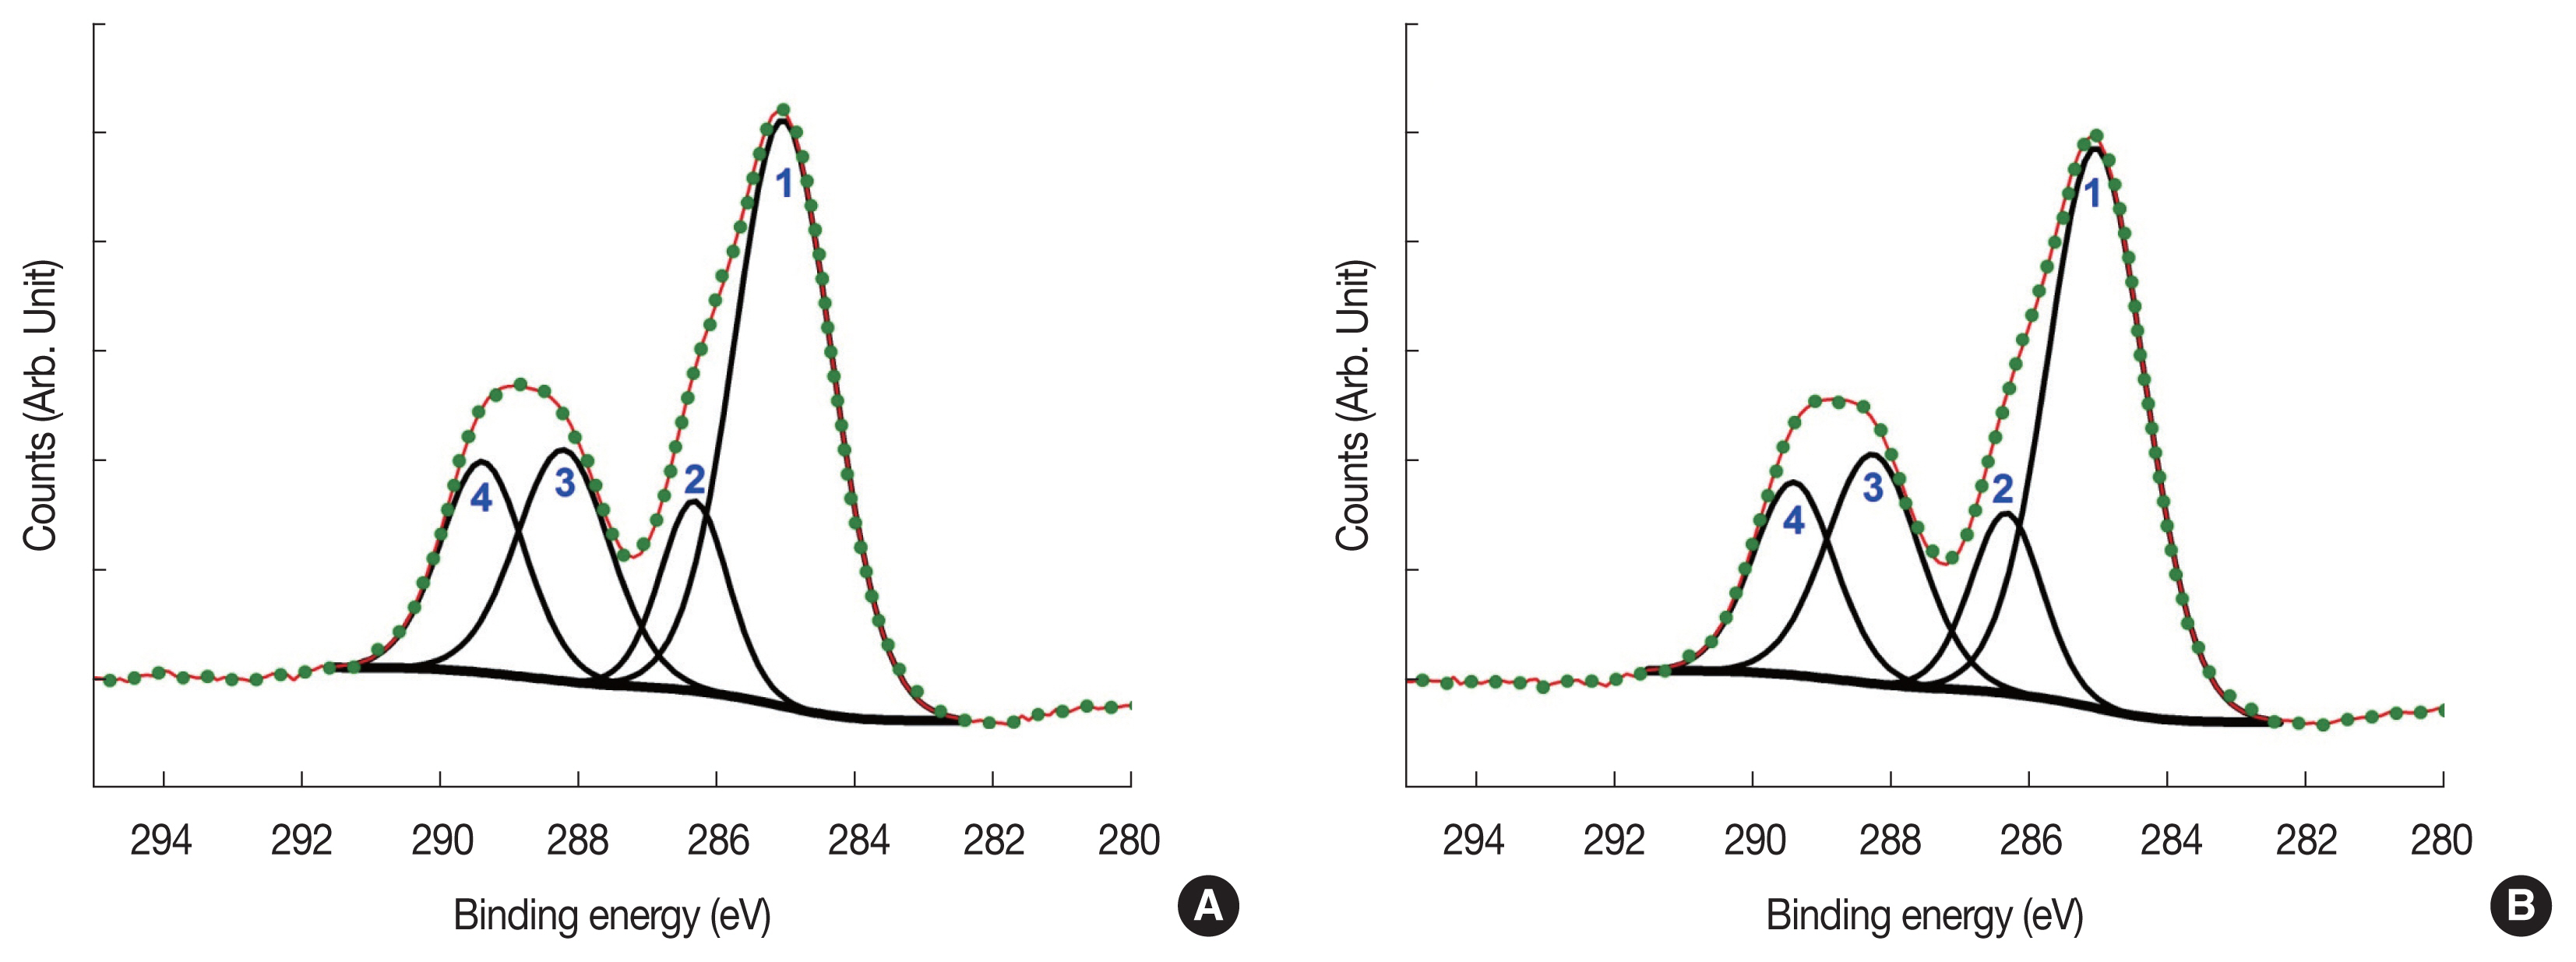
X-ray photoelectron spectroscopy spectra of C1s region for thymine: (A) thymine without electron irradiation and (B) thymine with electron irradiation. Dots indicate the raw spectra, narrow lines the curve-fitted peaks, and thick lines at the bottom the backgrounds. Counts per second on the horizontal axes are given in the arbitrary units.

Binding Energies of the Bonds and Relative Sizes of Each Bond Peak without and with Electron Irradiation
This means that a single XPS spectrum could have several components from these different bonds and have to be curve-fitted into constituent peaks accordingly, the results of which are also presented in Fig. 2. In Fig. 2, dots indicate the raw C1s spectra, narrow lines the curve-fitted peaks, and thick lines at the bottom the backgrounds. In Table 1, each constituent peak is assigned to a proper bond. The changes in the areas (i.e., photoelectron counts) of the constituent peaks between without-irradiation and with-irradiation should be linked to the dissociation of the corresponding bonds. These changes are also tabulated in Table 1. The areas of some peaks are increased, while others are decreased by electron irradiation. However, we have to be careful in interpreting these changes. It requires a caution to compare the photoelectron counts (areas) from the irradiated samples and those from the un-irradiated samples, because these two groups (i.e., irradiated and un-irradiated groups) of samples were independently prepared and independently XPS-analyzed. And, that is the reason for us to put the counts axes of Fig. 2 in an arbitrary scale. Even though we have done our best to make identical samples and to XPS-analyze under the same condition, there can be a slight difference between two groups of the samples in sample preparation and in XPS analysis. To minimize this difference, we have made 9 samples for the irradiated group and un-irradiated group, respectively. And we averaged the total photoelectron counts of two groups after XPS analyses to find out there was about 1%–2% slight reduction in counts after electron irradiation. Considering the reduction in the total photoelectron counts, the decreases of peaks 1 and 3 in Table 1 could actually be slightly larger than those given in Table 1. In the contrary, the relative increases of peaks 2 & 4 in Table 1 could partially be cancelled by absolute decrease of total counts and there could be virtually no change to these two peaks or only a very slight change, if any. Therefore, we will pay more attention to the changes in peak 1 and 3 in Fig. 2.
From Table 1 and Fig. 2, we inferred the meanings indicated by the increases in the areas of the peaks 1 and 3. The peak 1 near 285 eV which is corresponding to C-H and C-C bonds was decreased by 0.9% relatively, but actually should be around 2% in absolute counts. The same is true for the peak 3 which is corresponding to N-C=O bond: it was decreased by 2% relatively, but definitely 1%–2% more than that in absolute counts. These mean that the bonds including C-H, C-C, and N-C=O must have been dissociated. To be more specific, we could use the assignments by Plekan et al [19]. They have assigned an origin of each curve-fitted peak of thymine XPS spectra to an atom(s) in thymine. Following their assignment, peak 1 in Fig. 2 is relevant to carbon #1 and #2 in Fig. 3. Similarly, peak 2 is relevant to carbon #3, peak 3 to carbon #4, and peak 4 to carbon #5. Based on these two assignments—bond assignment given in Table 1 and atom assignment given by Plekan et al. [19], we can more specifically interpret our results that the decrease of peak 1 is indicating the dissociation of C1–C2 bond and that the decrease of peak 3 means the dissociation of N-C4=O. This interpretation is partially supported by mass-spectrometric measurements of Abdoul-Carime et al. [20]. They detected CN and OCN fragments from thymine when they irradiated the samples with 0.5–30 eV electrons. Therefore, we can conclude that, with 5-eV electron irradiation, C-C and N-C=O bond are primary dissociations occurred in thymine molecule.
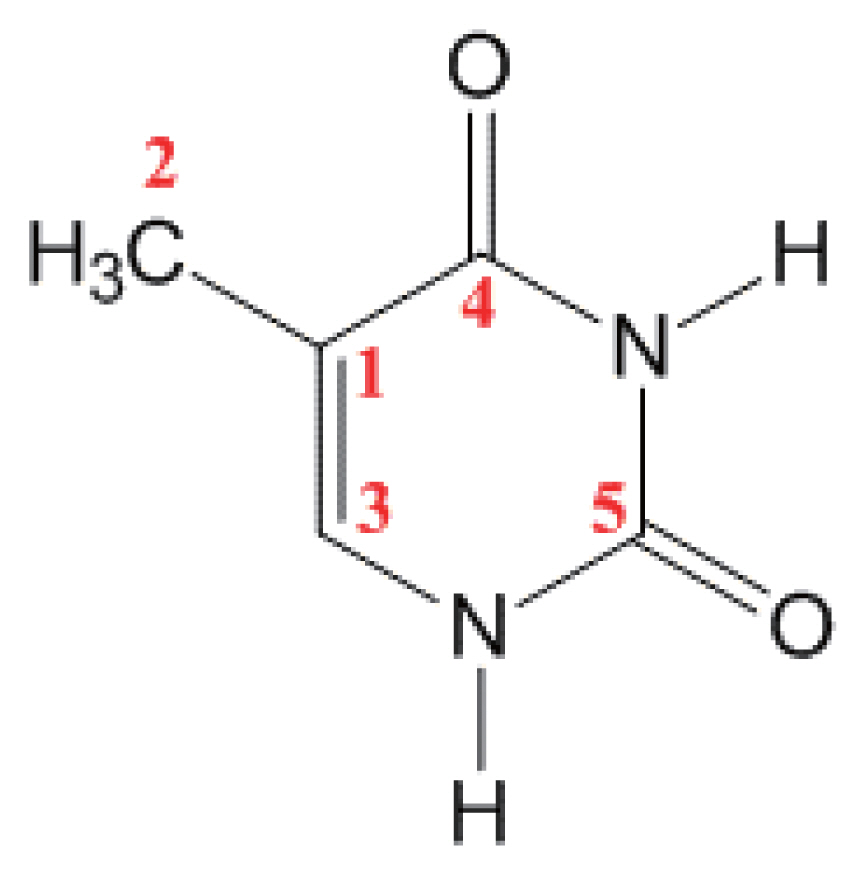
Thymine with the numbers assigned to some atoms (see the text for the use of the numbers).
We have also obtained the N1s and O1s spectra of thymine. And as can be seen in Fig. 3, there are two nitrogen and two oxygen atoms in one thymine molecule. Peaks originated from two nitrogen atoms or two oxygen atoms are supposed to be very close together and, consequently, cannot be resolved by most XPS systems including the one we used. When we tried to curve-fit N1s and O1s spectra, each spectrum was fitted into only one curve. Therefore, we cannot derive such information as we did for C1s.
Conclusion
Thymine was irradiated with 5-eV electrons and XPS technique was used for analyzing the bond dissociation in thymine. We concluded that, with 5-eV electron irradiation, C-C and N-C=O bond are primary dissociations occurred in thymine molecule. Further detailed studies at different electron energies and for other nucleobases will be underway.
Acknowledgements
This work was supported by research fund of Chungnam National University in 2016.
Notes
Conflict of Interest
No potential conflict of interest relevant to this article was reported.