

Introduction
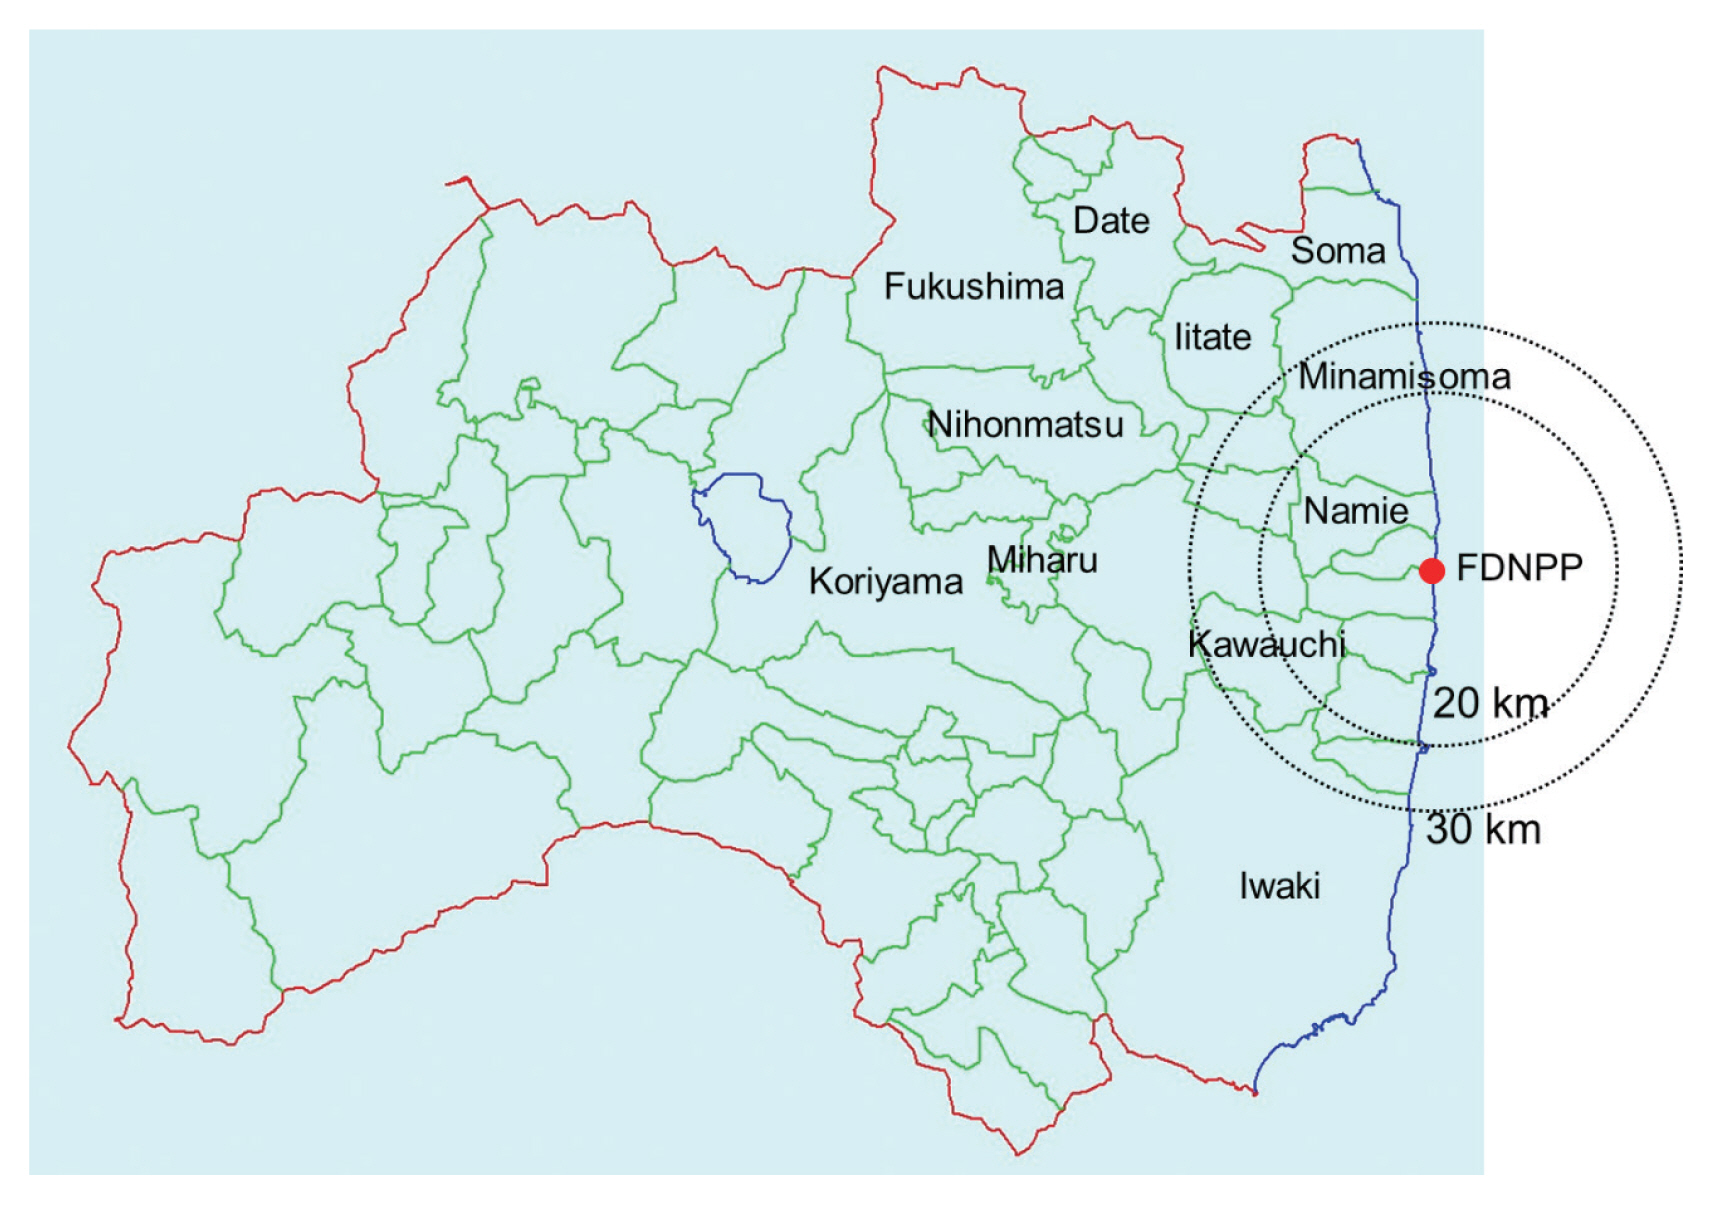
A large amount of radionuclides was released into environment due to the Fukushima Daiichi Nuclear Power Plant (FDNPP) accident, which caused internal and external exposure to the public. International organizations such as the World Health Organization (WHO) and the United Nations Scientific Committee on the Effects of Atomic Radiation (UNSCEAR) reported public doses due to this accident a few years after the event. However, these doses were generally overestimated, because they were based on conservative assumptions. WHO reported that adult residents of two affected areas (Namie Town and Iitate Village, their locations are shown in Fig. 1) received effective doses of 10ŌĆō50 mSv for the first year after the accident in its first 2012 report [1]. These values were cited in an article in Nature [2] and were repeated by others. Later, a revised dose band of 12ŌĆō25 mSv for the same areas was reported in WHOŌĆÖs second report in 2013 [3]. However, it was still based on conservative assumptions that people in deliberate evacuation areas stayed there for the first 4 months although the inhabitants were subjected to relocation at different times during the 4-month period.
The first-year doses for the same areas reported in the UNSCEAR 2013 Report [4] were further decreased: around 8 mSv for adult evacuees from Iitate Village and 5.0 or 7.0 mSv for adult evacuees from Namie Town (depending on evacuation routes). Still, the UNSCEAR Report stated that it was likely that some overestimation had been introduced generally by the methodology used by the Committee. UNSCEAR published ŌĆ£white papersŌĆØ [5] that reviewed publications after the 2013 Report, but the doses estimated in the 2013 Report were not changed.
Since the WHO and UNSCEAR 2013 Reports, more realistic dose values have been reported by Japanese scientists. Reviews on those studies have been published [6, 7], but the present paper aims at reviewing papers including the most recently published articles (articles accepted until the end of 2019) by Japanese scientists. The present paper focuses on effective dose only and does not deal with thyroid dose, because a review paper about thyroid dose will be published in this journal by another author. The locations of municipalities mentioned hereafter are shown in Fig. 1. Also, the dose values mentioned in the present paper indicate additional dose due to the accident excluding dose due to natural radiation, unless otherwise noted.
Methods for External Dose Estimation
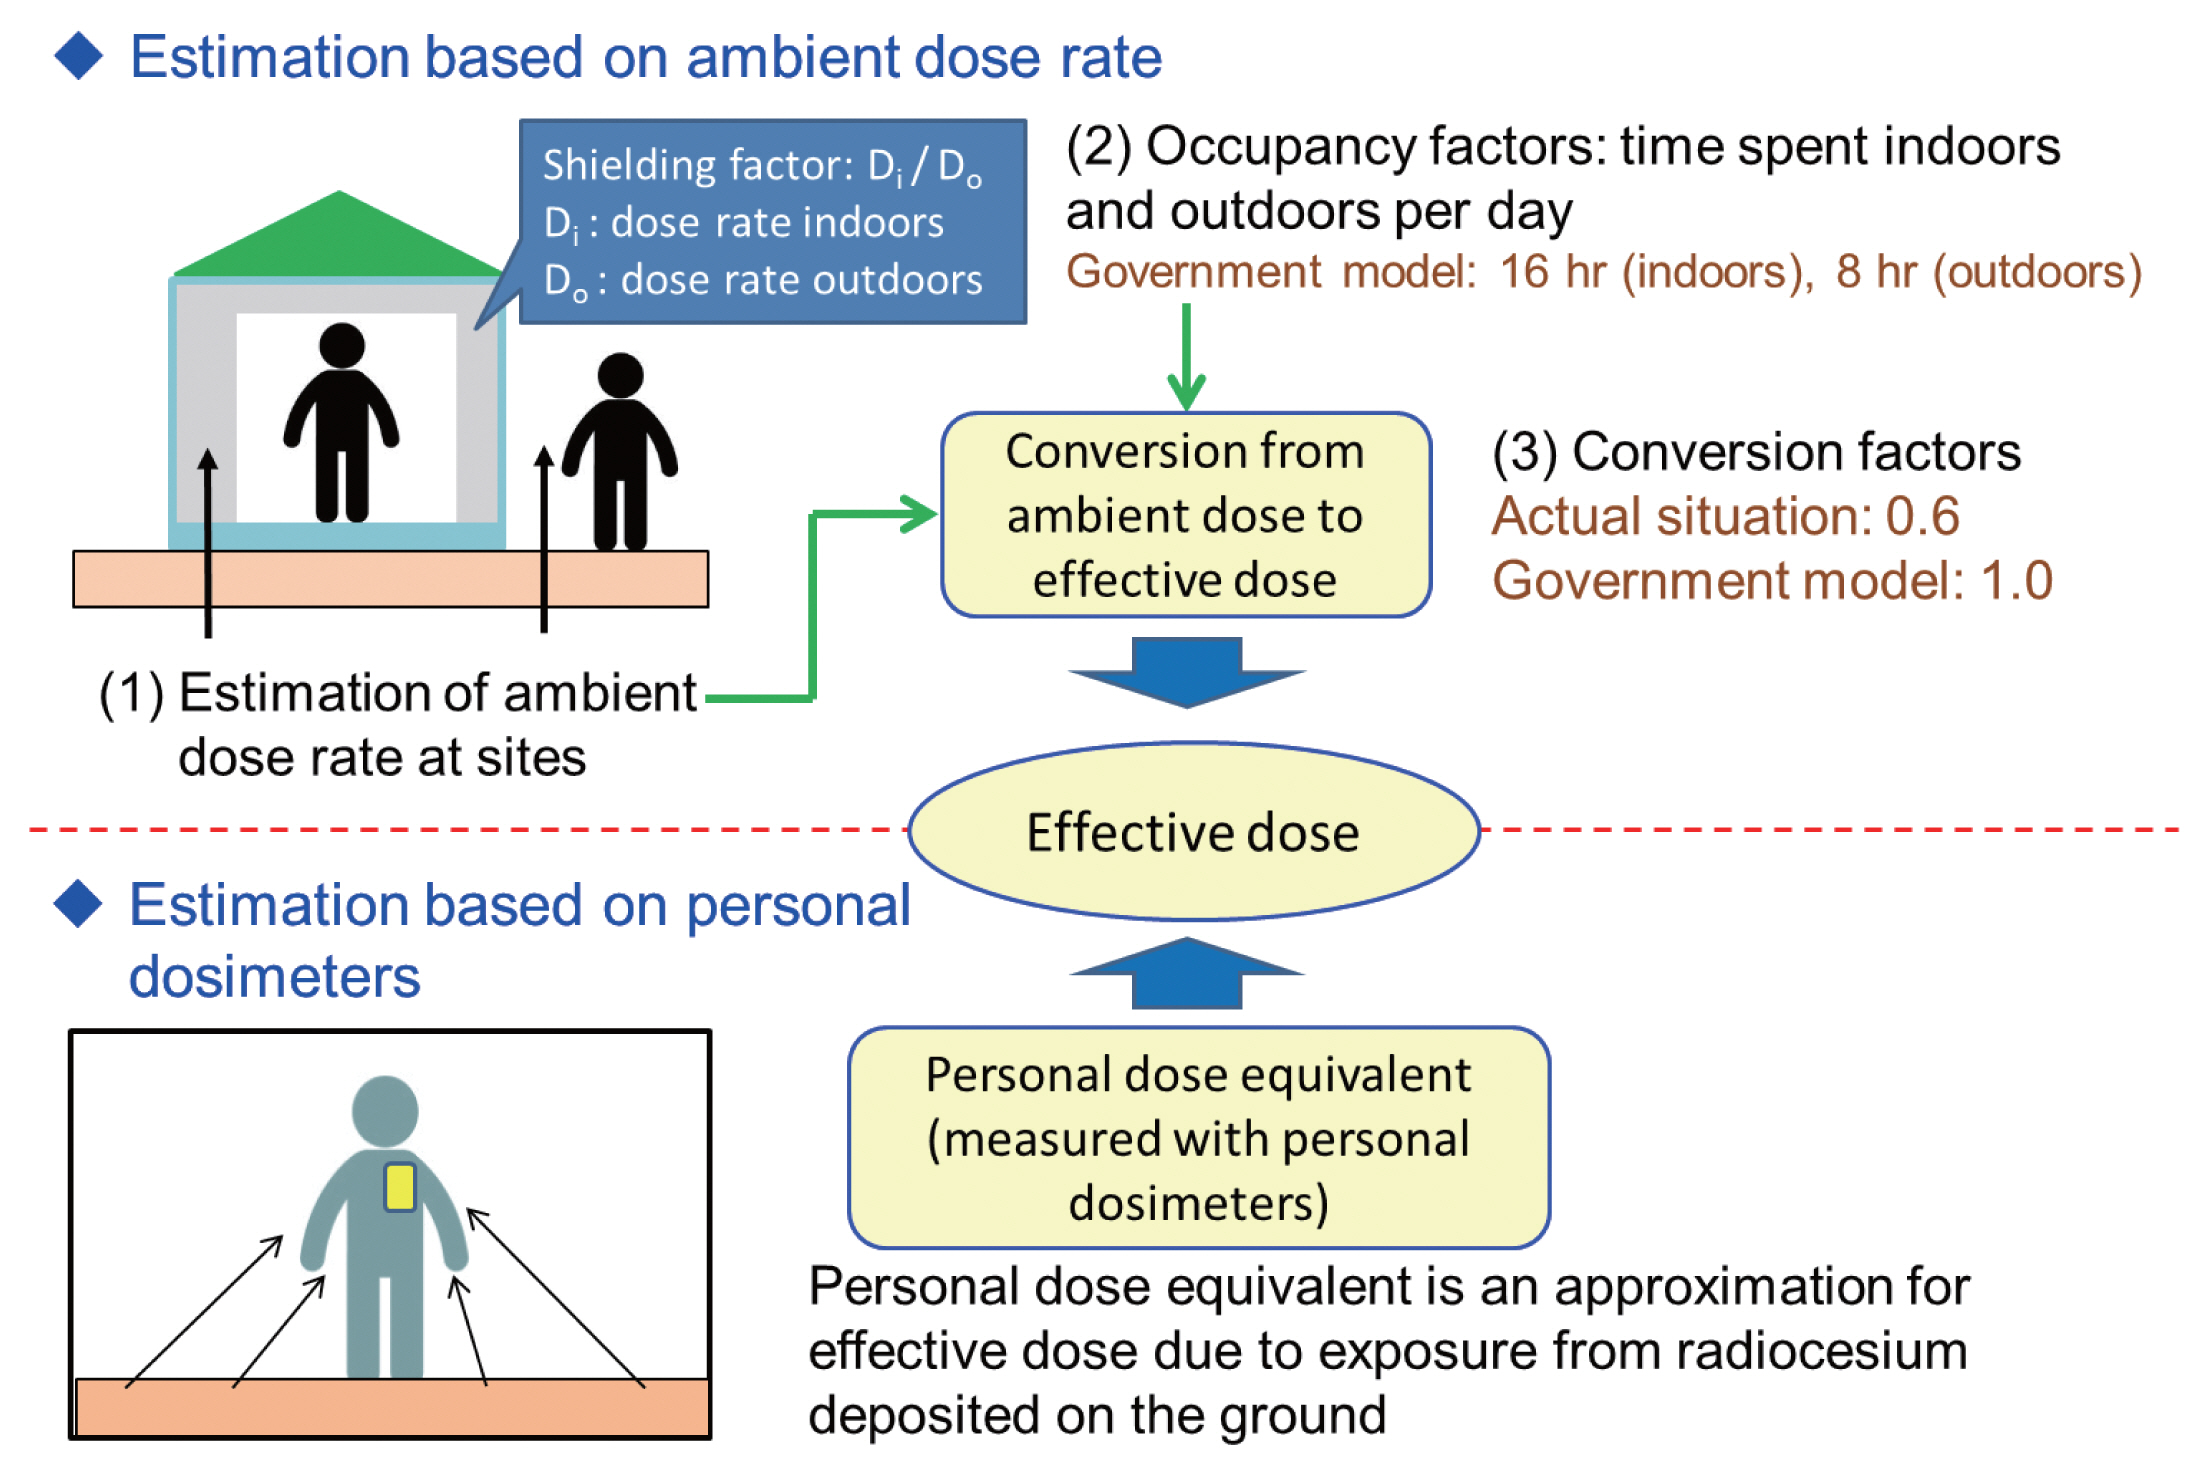
Fig. 2 illustrates two typical approaches for external dose estimation. One is estimation from ambient dose rate. Distribution of outdoor ambient dose rate for an area can be estimated by various methods such as car-borne and airborne (helicopter) monitoring [8]. Also, ambient dose rate can be calculated from radionuclide concentration in soil (or deposition density) using conversion coefficients [9]. In this approach, factors affecting accuracy of dose estimation could be: (1) estimation of ambient dose rate for sites (indoors/outdoors) where target individuals spent time; (2) their occupancy factors (behavior patterns); and (3) the conversion factor from ambient dose to effective dose. In most cases, ambient dose rate indoors is estimated by using appropriate shielding factors and ambient dose rate estimated for neighboring places outdoors.
The other approach is to use personal dosimeters. In this approach, the proper use of personal dosimeters (i.e., wearing dosimeters all the time in principle) is important for accuracy of the measured dose. The personal dose equivalent, measured with personal dosimeters, obtained in the geometrical conditions of the affected areas in Fukushima Prefecture is known to be comparable with the effective dose of isotropic or rotational irradiation geometries [10].
In an early stage after the accident, the Japanese government adopted external dose estimation with two conservative assumptions that: (1) people stay 16 hours indoors and 8 hours outdoors; and (2) the conversion factor from ambient dose to effective dose equals one. Hereafter, this estimation method is called the ŌĆ£government modelŌĆØ [11]. However, the time spent outdoors was generally much less than 8 hours. Also, the conversion factor appropriate for situations in Fukushima was around 0.6 [8]. Thus, individual effective dose was overestimated with these assumptions in most cases. The Japanese government changed the policy later and started to recommend use of personal dosimeters to estimate individual doses. On the other hand, the estimation from ambient dose rate remains useful in the case that people predict their individual doses before returning to their hometown [12]. How these two approaches have been used after the accident are described below.
Estimation from Ambient Dose Rate
1. Dose Assessment using Actual Behavior Records
In an early stage after the accident, personal dosimeters were not widely available for the public. As noted above, how occupancy factors (behavior patterns) are assumed is one of the influential factors for dose estimation from ambient dose rate. Some evacuees had complex behaviors including multiple moves. Therefore, obtaining records of individual behavior (such as post-disaster evacuation behavior) from residents, and combining this information with ambient dose rate was considered to estimate external dose.
This was conducted as the ŌĆ£Basic SurveyŌĆØ, a part of the Fukushima Health Management Survey [13]. Details of the Basic Survey are described elsewhere [14]. Questionnaires asking behavior patterns for the first 4 months after the accident were sent to all persons registered as Fukushima Prefecture residents (around 2 million), including residents of non-evacuated areas. The Basic Survey estimates individual external effective doses using the digitized behavior records and a calculation program which includes 2├Ś2 km2 mesh daily ambient dose rate maps.
Individual external doses for the first 4 months were estimated for about 475,000 persons. Although the maximum dose was 25 mSv, 94% of the doses were less than 2 mSv. The Basic Survey also revealed actual occupancy factors after the accident. In the case of Iitate Village, average time spent outdoors per day was around 2 hours [15], which was much shorter than the 8 hours used by the government model. According to the Basic Survey, age dependence of individual effective doses was not so large: the 4-month doses for infants (<6 years old) and children (6ŌĆō15 years old) were 1.1 times and 1.04 times larger than that for adults (>15 years old) on average in non-evacuated areas [16]. The ratios were smaller than those estimated by the UNSCEAR 2013 Report: around 1.7 times and 1.4 times smaller for infants and children for the first-year dose.
2. Dose Assessment using Typical Behavior Patterns
The UNSCEAR 2013 Report estimated municipality-average doses using this approach for non-evacuated areas [4]. The dose estimation was based on (1) ambient dose rate calculated from measured deposition density data and (2) several occupancy factors depending on age groups and occupation (outdoor worker/indoor worker). For evacuees, UNSCEAR used 18 typical evacuation patterns [17] to estimate their doses.
Dose estimation based on some typical behavior patterns by age group or occupation could give a more realistic dose than that estimated using a fixed pattern like 8 hours outdoors and 16 hours indoors. Takahara et al. [18, 19] investigated behavior patterns for four population groups: Fukushima City Office staff, senior citizensŌĆÖ club members, contractorsŌĆÖ association members, and agricultural cooperative members. Then, probabilistic dose assessments were made for these population groups by considering the spatial variability of ambient dose rate and interpopulation differences resulting from behavior patterns. Mori et al. [20] applied the probabilistic approach to estimate the external doses that children would receive after returning to evacuated areas. Application of this approach is described in another paper of this journal in more detail [8].
3. Issues Related to Dose Assessment from Ambient Dose Rate
Among the three factors affecting individual external dose assessment (Fig. 2), the Basic Survey has an advantage for the second point (obtaining actual behavior records), but it has disadvantages for the first point. In the Basic Survey, outdoor ambient dose rate was assumed to be uniform within 2 km├Ś2 km mesh areas, but strictly speaking, that would not be true. Also, the Basic Survey used a fixed shielding factor for each type of building (e.g., 0.4 for wooden houses) to estimate indoor dose rate from outdoor dose rate, but the factor could differ from house to house [12].
Even for the second point, the Basic Survey was considered to have a potential weakness: it relies on peopleŌĆÖs memories for the behavior records and ŌĆ£recall biasŌĆØ may affect the individual doses. However, a comparison between dose estimates based on behavior records collected before and those collected recently indicated that the effect of recall bias could be small [21].
Another issue is that the Basic Survey is a volunteer-based survey, while the dose assessment using typical behavior patterns can be applied to a whole population group. Due to this concern, representativeness of individual doses estimated by the Basic Survey was investigated [22]. Although the response rate to the Basic Survey questionnaires was around 27%, the dose distribution was considered to be representative for the whole prefecture, according to a statistical test.
Estimation from Personal Dosimeters
1. Integrating-Type Personal Dosimeters
1) Personal doses in the rehabilitation phase
Around a half year after the accident, measurements of external dose for residents by using integrating-type personal dosimeters (glass badges) were started on a large scale by local governments of Fukushima Prefecture. Because the measurements had an important aspect of risk communication, residents were notified of the estimated personal doses. Also, most of the municipalities have disclosed overall results to residents (e.g., Koriyama City [23] and Fukushima City [24]). Generally, children and pregnant women were considered to have high priority for personal dosimeter measurements at first. Later on, the target users were expanded to residents of all ages who wish to measure their personal doses. In 22 municipalities of Fukushima, the estimated median annual external dose was reported to be <1 mSv in 2011 [25]. Some municipalities continue the measurements even now.
Some scientific papers reported results for specific areas (Minamisoma City, Soma City, Nihonmatsu City). A paper on Soma City showed that the geometric mean levels of annual doses from external exposure decreased each year: 0.60 mSv, 0.37 mSv, 0.22 mSv, 0.20 mSv, and 0.17 mSv in 2011, 2012, 2013, 2014, and 2015, respectively [26]. The proportion of residents with annual doses from external exposure of more than 1 mSv dropped from 15.6% in 2011 to zero in 2015. For Minamisoma City, the calculated annual effective dose from external exposure ranged from 0.00 to 3.45 mSv (median, 0.66 mSv), based on measurements conducted from June 2012 to February 2013 [27]. Here, measured values below a background dose (0.54 mSv per year) were treated as an additional dose of zero. In Nihonmatsu City [28], the mean dose 6 months after the accident was reported to be 1.5 mSv, when converted to annual dose. The annual dose was the same (1.5 mSv) in 2012, but decreased to 1.0 mSv in 2013, and 0.65 mSv in 2014.
Integrating-type personal dosimeters cannot identify the major contribution to received dose. Then, regarding this point, Nomura et al. [29] investigated the relationship between behavioral patterns of school children and personal dose. According to them, outdoor activities had no statistically significant relationship to the personal dose. Their results indicated that behaviors related to outdoor activities, such as commuting means and hours spent, and hours spent outdoors after school and on weekends, had no significant statistical relationship with the doses over the 3-month period. Meanwhile, a 0.1 ╬╝Sv/hr increase in the ambient dose rate at home was associated with a 10% increase in the dose (p<0.001). The study indicated that the ambient dose levels at the places where children spend most of their day were the significant predictors of the dose.
2) Effects of decontamination on personal dose
As described previously, personal doses in the same areas generally decreased during the course of time (year-to-year), although the subjects for each year were not the same. In addition to physical decay of deposited radionuclides, weathering and decontamination could play a role in the decrease of personal doses. The UNSCEAR 2013 Report estimated 10-year and lifetime doses, but it did not consider effects of decontamination.
Although it was reported that decontamination decreased ambient dose rate [30], it was not demonstrated whether or not the decontamination surely lowered personal doses. The first report on this appeared in 2019 [31]. The annual DRRs (dose reduction rates for personal dose) in areas that had undergone decontamination for both adults and children were significantly higher than those in areas without decontamination. The higher the dose at the time decontamination was started, the greater the DRR by decontamination, regardless of the timing of the decontamination. Effects of decontamination was also investigated from airborne monitoring results of the same areas [32]. Airborne monitoring was seen to be less sensitive to the effects of decontamination than individual monitoring. This result may be due to airborne monitoring also including non-decontamination areas (e.g., forests) or being affected by surrounding areas.
3) Doses for returnees
A few years after the accident, the government started lifting evacuation orders in some areas. People began to return to or temporally stay in their hometown in such areas. Some studies reported personal dosimeter measurements made by such returnees. In the case of Kawauchi Village, the maximum cumulative individual dose was 3.28 mSv per year, and the median and minimum doses were 1.35 and 0.71 mSv per year for those who returned in 2013 [33]. Another study investigated returnees to Minamisoma City [34]. Doses for a total of 112 returnees to Odaka district (where all residents were forced to evacuate elsewhere at the time of the accident), in Minamisoma City, were compared to 266 non-returnees. The proportion of participants with annual doses from external exposure above 1 mSv was 7.0% for returnees, and 7.3% and 4.2% for non-returnees living in other districts of the city and outside it, respectively.
2. D-Shuttle
Although glass badges are useful in large-scale personal monitoring, their disadvantages are that (1) they generally need a measurement period of a few months and (2) it is not possible to determine when and where the person is exposed (at home, at work, etc.). A personal dosimeter, D-shuttle, overcoming these disadvantages was developed in 2013 by AIST (National Institute of Advanced Industrial Science and Technology) and it was made commercially available by Chiyoda Technol Corporation [35]. D-shuttle enables users to record hourly personal doses and to read out the hourly doses anytime by using a dedicated device for its administration.
Studies using the D-shuttle in combination with GPS systems allowed identification of exposure levels, locations, and times. In particular, it was possible to find the dominant exposure in the total exposure. Identifying source contributions to the total dose is important in determining effective dose reduction measures. In this respect, it has been broadly used for risk communication in Fukushima Prefecture [36, 37].
As described previously, personal doses for hometown returnees were obtained using integrating-type personal dosimeters. Monitoring for those people also has been done using the D-shuttle [38, 39]. A 2020 publication analyzed doses for 239 voluntary participants among returnees across ten municipalities [40]. Monte Carlo simulations used for quantifying both uncertainty and population variability of observed data demonstrated that the mean of the annual dose in 2019 (including natural background doses) was 0.93 mSv (95% uncertainty interval, 0.53ŌĆō1.76 mSv), with limited variation among municipalities.
3. Issues Related to Personal Dosimeter Measurements
1) Relationship between ambient dose and personal dose
Since personal dosimeters have come into large-scale use, it has become necessary to give the public a reasonable explanation for the discrepancy between external dose estimated by the government model and that estimated with personal dosimeters. Related to any explanation would be the consideration that airborne monitoring can grasp the distribution of air dose rate widely and quickly, while individual dose estimation by personal dosimeters takes time in the case of glass badges and future doses after returning to former evacuation areas cannot be predicted. Then, it would be useful for a rapid understanding of individual dose levels, if individual dose levels are estimated from airborne monitoring results. In particular, it would be useful for those who wish to return to former evacuation areas.
Thus, the relationship between ambient dose rate and personal dose has been studied by several groups of investigators. Nomura et al. [41] compared individual dose levels directly measured with personal dosimeters and those reconstructed by the government model. The reduction factor (RF), which is defined as the ratio of the additional individual external doses to the additional ambient doses, was 0.3┬▒0.1 on average, whereas the value used in the government model was 0.6. Major potential causes of the discrepancy were (1) the conversion factor from ambient dose to effective dose that was used (the government model used 1.0, although it is actually around 0.6 [8]) (Fig. 2) and (2) less time being spent outdoors than was assumed in the government model (8 hours).
Naito et al. [38, 42, 43] conducted several studies on this topic using the D-shuttle. Their study [42], including participants from Fukushima City, Koriyama City, and Nihonmatsu City, showed that, for most study volunteers, the exposure from staying at home represented about half of the total cumulative dose and on average the RFs reported were about 0.3. This was similar to the value estimated by Nomura et al. [41] using integrating-type dosimeters (glass badges). The third study conducted by Naito et al. [43] showed that the RFs were on average 0.14 and 0.32 for time spent at home and outdoors, respectively. They considered reasons for this discrepancy as the values of background doses used to estimate additional dose, consideration of decay in the ambient dose determination, and differences in number and type of participants. The study that Naito et al. [38] conducted in Iitate Village showed the medians of the average RFs were 0.13 (minŌĆōmax, 0.06ŌĆō0.27) for time spent at home and 0.18 (minŌĆōmax, 0.08ŌĆō0.36) for time spent outdoors.
2) Interpretation of personal dose measurement results
When interpreting results obtained with personal dosimeters including the D-shuttle, several points need to be considered: (1) participant selection bias, (2) conditions of use, and (3) background dose.
First, the personal dose measurement conducted by local governments of Fukushima Prefecture was basically volunteer-based. Also, soon after the accident, the main targets for personal dosimeter measurements were children and pregnant women [26, 27]. These conditions present no problem in individual risk communication, but they present issues of selection bias in a large-scale survey to estimate dose distribution as a whole for a municipality level. Monte Carlo simulation could be a useful tool to examine representativeness of study participants [40].
The second point affects measured values, and it is related to whether or not personal dosimeters were wore in a proper manner. Nomura et al. [44] investigated this issue. Data from children who did not wear the dosimeters to school and outdoors had statistically significant errors (ratio: 1.13, p<0.01 and 0.97, p<0.05, respectively), whereas improper use of the dosimeters at school, at home and at bedtime did not generate significant errors. Considering the small dose error due to the improper use of the dosimeters, however, solid evaluation of external dose may be possible with some accuracy, even if the dosimeters are not properly used.
Third, it is difficult to estimate an accurate background dose (the dose due to natural radiation) for each subject. The background dose could differ from place to place, but discriminating the natural radiation dose from the dose due to the accident needs a spectroscopic measurement at each place [45]. In Fukushima Prefecture, integrating-type personal dosimeters from two manufacturers were mainly used. One manufacturer used 0.54 mSv per year as the background dose, which was based on measured values in a place distant from Fukushima. The other used ŌĆ£control badgesŌĆØ to estimate background dose [28]. It is a reasonable expectation that the background dose will depend on where the control badges are placed. The D-shuttle also includes background radiation in its measurements and estimating additional dose from measured results needs to take background dose into consideration.
Methods for Internal Dose Estimation
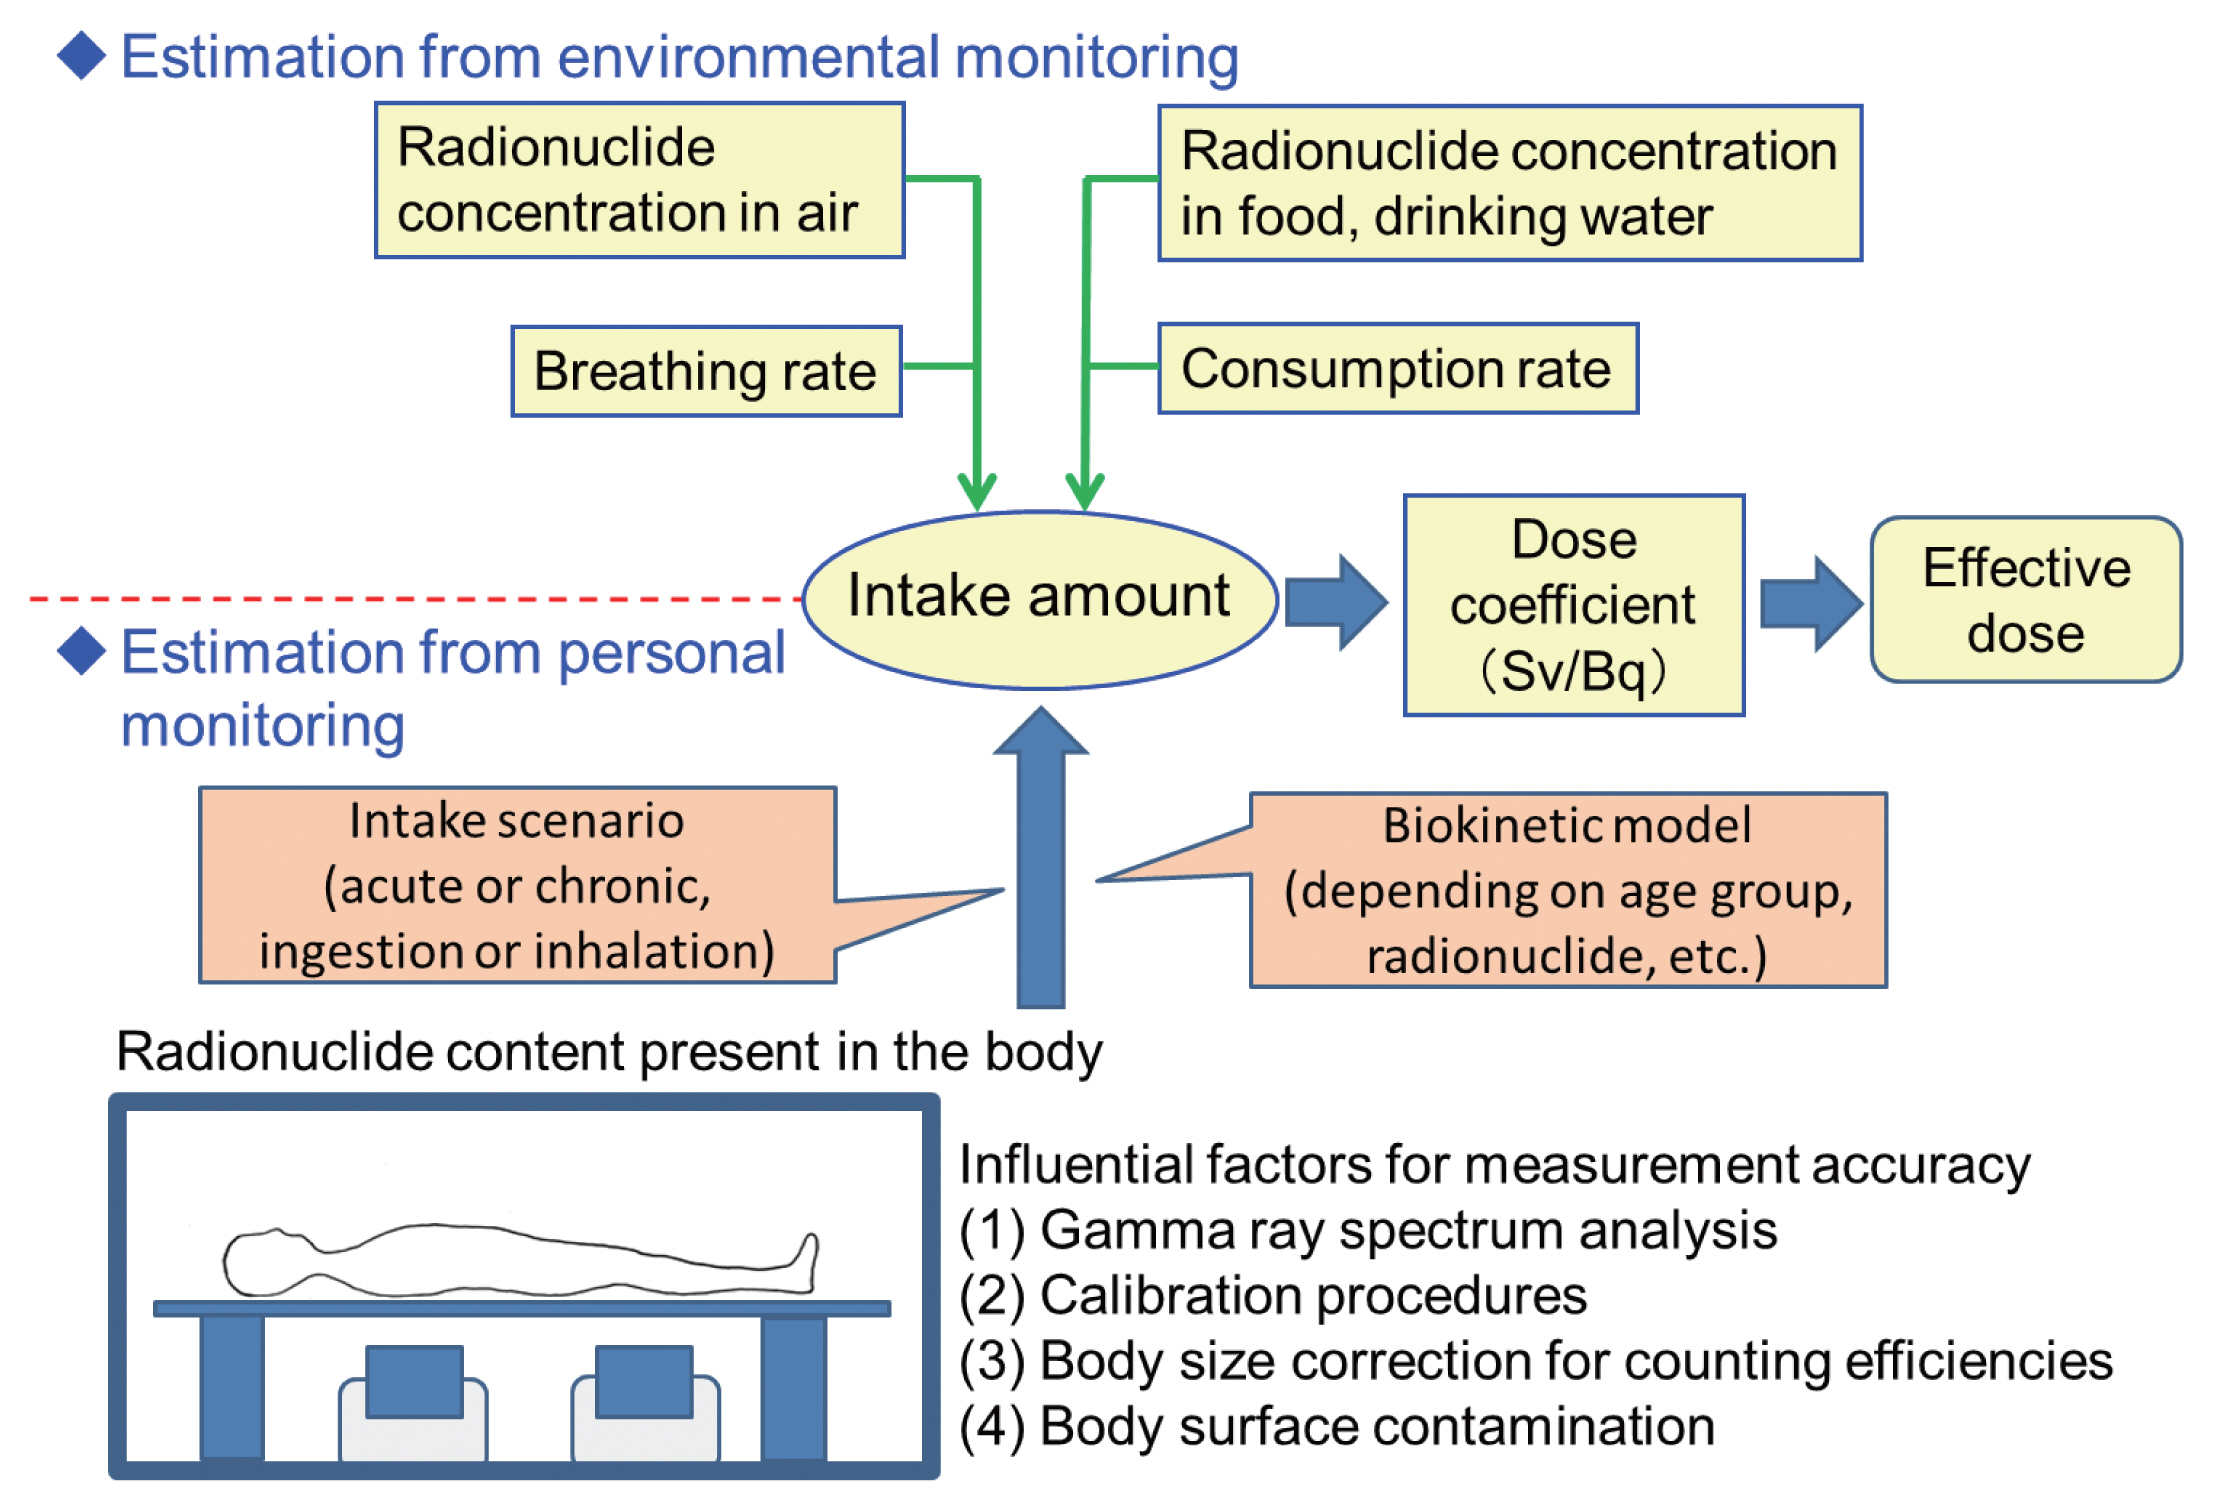
Internal dose estimation can be categorized into two approaches: estimation from personal monitoring and estimation from monitoring of environmental samples such as radioactivity concentration in food and drinking water (Fig. 3). Both approaches aim at estimating intake amount of radionuclides. Then, multiplying the estimated intake by dose coefficients presented by the ICRP is a common method to estimate committed effective dose (CED). Estimation of internal dose from bioassay samples such as urine can be classified as personal monitoring, but only one report could be found for dose estimation by a bioassay method after the Fukushima accident [46]. Thus, this section deals only with whole-body counting (WBC) as personal monitoring. Dose estimations after the accident by these two categories of approaches are described below. Hereafter, the term ŌĆ£CEDŌĆØ is used as CED only from 134Cs and 137Cs, unless otherwise noted.
1. Estimation by Whole-Body Counting
Immediately after the accident, no whole-body counters were available in Fukushima Prefecture. Thus, initially whole-body counters located outside the prefecture were utilized for measuring 134Cs and 137Cs body contents for residents from Fukushima Prefecture.
Morita et al. [47] reported internal contamination level for evacuees from Fukushima after the accident using a whole-body counter at Nagasaki University. Measurable 134Cs and 137Cs amounts were detected in 49 out of 196 people who were in Fukushima Prefecture at any time during March 11 to April 20, 2011. Among these 49 people, the 90th percentile CED value was 0.06 mSv.
The Fukushima Prefecture government organized WBC measurements by a committed institute, the National Institute of Radiological Sciences, which started at the end of June 2011 [48]. A total of 174 subjects mostly from evacuated areas were measured until the end of July. The 90th percentile CED value for adults was around 0.1 mSv and the maximum CED (0.63 mSv) was found in an elderly male.
Another committed institute, the Japan Atomic Energy Agency (JAEA), started WBC measurements on July 11, 2011. A total of 9,927 subjects were measured until the end of January 2012. Most of these subjects were residents of evacuated areas. The median CED values were 0.02 mSv and 0.025 mSv for subjects aged 13ŌĆō17 years and for subjects aged >17 years, respectively [49].
Several months after the accident, installation of whole-body counters in Fukushima Prefecture was started. Some of them were a mobile type. The installed whole-body counters were operated either by (i) Fukushima Prefecture including its commissioned organizations such as JAEA; (ii) local governments (municipalities); or (iii) organizations independent of the prefectural or local governments. Data on measurements conducted by operators of category (i) have been collected by the Fukushima Prefectural government and they are periodically reported on webpages of Fukushima Prefecture [50]. According to these webpages, persons with CEDs greater than or equal to 1 mSv numbered 26 among more than 340,000 subjects measured. Also, no subject with a CED greater than or equal to 1 mSv was found after March 2012 (1 year after the accident).
Some results obtained by operators for categories (ii) and (iii) have been reported as scientific papers: these papers included subjects of Minamisoma City [51, 52], Iwaki City (including its suburbs) [53, 54], Namie Town [55], and Miharu Town [56], and subjects in and around Fukushima Prefecture [57, 58]. All papers reported very low doses as follows: (1) among 9,498 residents measured between September 26, 2011 and March 31, 2012, CEDs were less than 1 mSv except for 1 resident (1.07 mSv) [51]; (2) CEDs of 566 high-risk residents measured about 4 months after the accident were found to be less than 1 mSv [52]; (3) the maximum CEDs in two studies were both less than 0.1 mSv [53, 54]; (4) the average CED for residents with detectable radioactivity of 137Cs or 134Cs was 0.025 mSv [55]; (5) no child was found to exceed the 137Cs detection limit of 300 Bq per body (corresponding to the CED of 0.04 mSv due to 137Cs for a 6-year old) in 2012 and 2013 [56]; (6) among 2,700 babies, none had detectable levels of 134Cs or 137Cs (the detectable level of 137Cs corresponds to 0.016 mSv per year including the contribution from 134Cs) [57]; and (7) between 12 to 20 months after the accident, the 137Cs detection frequency was 1.0% among all ages (0.09% among children) [58].
As mentioned before, personal dosimeters were utilized for estimating external doses for returnees to the former evacuation order areas. Most municipalities in such areas organize opportunities for persons to undergo WBC so that they can check their own internal contamination, if they wish. WBC results for returnees to Kawauchi Village were reported by Tsubokura et al. [59]. Although returnees had higher chances of consuming locally produced vegetables, proportions of individuals with internal radiation exposure above the 137Cs detection limit were 3.4%, 1.6%, and 3.1% for the returnees, commuters and non-returnees among the Kawauchi villagers, respectively. A Cochran-Mantel-Haenszel (CMH) test showed the level of internal radiation exposure for the returnees was not significantly higher than that in the two other groups. This indicated that it was possible to maintain internal exposure at very low levels even in a highly contaminated region.
2. Estimation from Environmental Monitoring Data
The UNSCEAR 2013 Report adopted this approach. It estimated ingestion dose based on a food database with some conservative assumptions. For example, many 134Cs and 137Cs concentrations in the database were shown as below the limits of detection and in these cases, it was generally assumed that 134Cs and 137Cs concentrations were each 10 Bq┬ĘkgŌłÆ1. The 2013 Report estimated inhalation dose based on atmospheric transport dispersion and deposition models for radioactive materials released from the FDNPP accident. The first-year dose due to ingestion was estimated to be 0.94 mSv for adults in non-evacuated areas. The first-year dose due to inhalation was estimated to be from 0 to 0.47 mSv for adults in non-evacuated areas, depending on location. Thus, the municipality-average first-year dose due to internal exposure ranged from 0.94 to 1.41 mSv for adults. Comparison with the WBC results mentioned in previous section indicates the dose was likely to be overestimated.
Actually, restriction orders for food supplies such as contaminated vegetables and milk, and intake of tap water were implemented within several days after the major release of radionuclides on March 15, 2011 [60]. In addition, collapse in supply chains, i.e., due to damage to distribution facilities, lack of transportation vehicles or electricity, and the closure of earthquake-damaged retail stores, contributed to a situation where contaminated food or supplies were not consumed in large quantities in general, even before the food restriction orders [61]. Due to this situation, ingestion of highly contaminated food was not likely to occur.
Harada et al. [62] estimated that the median CED was 23 ╬╝Sv due to dietary intake of 134Cs and 137Cs for the year, based on food-duplicate samples collected in December 2011. Their CED was estimated assuming that the dietary intake of 134Cs and 137Cs was constant throughout the year. Koizumi et al. [63] purchased fifty-five sets of meals, each representing one personŌĆÖs daily intake, in local towns in Fukushima Prefecture in July 2011 and analyzed them while including a daily tap water intake. The median CED was estimated to be 3.0 ╬╝Sv per year (ranging from not detectable to 83.1 ╬╝Sv per year), with the assumption that the dietary intake of 134Cs and 137Cs was constant throughout the year. Since 2011, 134Cs and 137Cs contents in food have been monitored and they seem to remain very low. Analyses by the duplicate diet method covering 100 families throughout Fukushima Prefecture showed that CED did not exceed 0.1 mSv [64]. Based on 7,668 food samples collected in Kawauchi Village in 2013 and 2014, Orita et al. [65] estimated that CED due to 1-year ingestion ranged from 24.4 to 42.7 ╬╝Sv for males and from 21.7 to 43.4 ╬╝Sv for females.
In this general situation that ingestion of highly contaminated food was not likely to occur, attention should be directed to residents who consume homegrown produce without radiation inspection, and who often collect wild mushrooms or cultivate their own mushrooms on bed-logs. Tsubokura et al. [66] advised those residents (n=9) to consume the distributed food mainly and to refrain from consuming potentially contaminated foods without a radiation inspection and local products under shipment restrictions such as mushrooms, mountain vegetables, and meat of wild game. A few months after the intervention, re-examination of 134Cs and 137Cs levels revealed remarkable reduction of internal contamination in all the nine residents.
3. Issues Related to Internal Dose Assessment
Technical issues raised for internal dose assessment by WBC of Fukushima Prefecture residents were well summarized by Kurihara et al. [67]. The issues can be categorized as follows: (1) setting a suitable intake scenario to estimate intake amount from measured 134Cs and 137Cs body content (acute or chronic, inhalation or ingestion); (2) avoiding interference by the natural radionuclide 214Bi in 134Cs detection (both radionuclides emit similar energies of gamma rays, which makes spectrum analysis difficult); (3) standardizing calibration and measurement procedures; (4) establishing a method for estimating 134Cs and 137Cs body contents of children (whole-body counters were originally designed for measuring adult radiation workers); and (5) avoiding effects on measurements due to body surface contamination.
The first issue is associated with how to estimate the intake amount from 134Cs and 137Cs body content (see Fig. 3), while the four other issues are related to measurement accuracy of 134Cs and 137Cs body content. Although the four issues on measurement accuracy have been settled to some extent, how to treat the first issue in estimating early intake remains somewhat controversial [68ŌĆō71].
Kunishima et al. [68] analyzed the relationship between evacuation behavior data obtained from 112 out of the 174 subjects who underwent WBC [48] and their CEDs. Most subjects living in municipalities near the FDNPP started evacuation promptly. The percentage of persons remaining within the 20-km radius area of the FDNPP was found to be 100% at 16:00 on March 12, 2011 and 42.9% at 0:00 on March 15 for those with CEDs >0.1 mSv, whereas the corresponding percentages were much lower for those with CEDs Ōēż0.1 mSv. Igarashi et al. [69] demonstrated that the 134Cs and 137Cs detection rates in the WBC results were both several times higher in the late evacuees (who evacuated outside the 20-km radius of the FDNPP at 15:00 on March 12 or later) compared to the prompt evacuees (who evacuated before 15:00 on March 12). These differences in 134Cs and 137Cs detection rates would be caused by exposure to the radioactive plume on the afternoon of March 12, which was likely to influence the late evacuees. Time-related changes in rate of positive detection of radiocesium (either or both of 134Cs and 137Cs) in WBC also supported that acute intake was the major contributor of 134Cs and 137Cs body contents [70].
On the other hand, Nomura et al. [71] showed that individuals who evacuated to areas outside Fukushima Prefecture had similar contamination levels of 134Cs to individuals who stayed in Fukushima (relative risk, 0.86; 95% confidence interval, 0.74ŌĆō0.99). They found that time spent outdoors had no significant relationship with contamination levels and they considered that effects of inhalation from radioactive plumes on total internal radiation contamination might be so low as to be undetectable by the WBC unit used to examine participants.
As mentioned in previous subsection, ŌĆ£interpretation of personal dose measurement resultsŌĆØ, representativeness of subjects is one of the concerns about volunteer-based monitoring. Representativeness of WBC subjects was investigated by Nomura et al. [72]. Based on regression projection techniques, separate probabilities for 137Cs and 134Cs detection for a whole population were simulated. They were compared with 134Cs and 137Cs levels measured from October 2011 to March 2015 for voluntary participants. They found sufficient agreement between simulated and measured 134Cs and 137Cs levels except for 134Cs in October 2011 and concluded that the voluntary monitoring participant group was a good representative sample [72].
Overview of Doses
1. Comparison of Different Methodologies for Dose Estimation
Doses reported by the publications reviewed in the present paper were summarized in Tables 1 and 2. Table 1 summarizes doses estimated for the first-year (or first 4-month) doses or doses estimated based on measurements within the first year after the accident. Table 2 summarizes doses estimated for periods after the first year. The doses in both tables are shown with information on methodology for dose estimation, target population (age groups and residential areas) and year of measurement.
Internal doses were basically shown as CEDs due to intake within the periods of interest. The CEDs in the reviewed publications were calculated based on either acute or chronic intake scenario. The scenario adopted for each publication is shown in Tables 1 and 2. The acute intake scenario assumed that the intake occurred just after the accident and no further intake occurred after that. As described previously, the acute intake scenario was considered to be reasonable especially in the evacuated areas [68ŌĆō70]. On the other hand, the chronic intake scenario assumed the same amount of consecutive intake for the period of interest in both approaches of food analysis and WBC. In the case of WBC, measured amounts of radiocesium (either or both of 134Cs and 137Cs) were assumed to be in an equilibrium state between consecutive ingestion and excretion throughout 1 year. The CEDs estimated by this scenario can be interpreted as resulting from ingestion that occurred within the year. An exception was the CED reported by Orita et al. [53] who calculated CED due to chronic ingestion from the day following the accident start to the day of measurement (more than 2 years as the longest period of assumed chronic ingestion).
The different methodologies shown in these tables can be compared in the following way. Regarding external dose estimation, personal dosimeters were not available on a large scale for up to around 6 months from March 2011. Thus, external dose up to then had to be estimated from ambient dose rate. As described before, Ishikawa et al. [14] estimated external doses taking actual behavior patterns into account, while WHO and UNSCEAR assumed typical behavior patterns. WHOŌĆÖs estimation was based on conservative assumptions that people in deliberate evacuation areas stayed there for the first four months although the inhabitants were subjected to relocation at different times during the four-month period. Also, Ohba et al. [73] showed that the actual behavior patterns of residents differed from the typical behavior patterns used by UNSCEAR, although they analyzed only residents aged less than 20 years. In this respect, the estimation by using actual behavior patterns could give more realistic doses.
As described in previous section, internal dose estimation can be categorized into two approaches: estimation from personal monitoring (WBC) and estimation from monitoring of environmental samples such as radioactivity concentration in food and drinking water. If the latter approach is adopted with conservative assumptions, it results in overestimation of dose. This was the case for UNSCEAR and WHOŌĆÖs dose estimations. That is, WHO assumed that all the food monitored was on the market although the monitoring data set included the results of food samples that were collected for monitoring purposes and were not allowed on the market [1, 3]. In the food database which UNSCEAR used, many 134Cs and 137Cs concentrations were shown as below the limits of detection and in these cases, it was generally assumed that 134Cs and 137Cs concentrations were each 10 Bq┬ĘkgŌłÆ1 [4]. These assumptions clearly lead to overestimation of ingestion doses. Thus, the first-year internal doses estimated for non-evacuees by UNSCEAR were much higher than those estimated for evacuees by WBC (Table 1). Considering such conservative assumptions, internal doses estimated by WBC could be more reliable. Although estimation from WBC has issues related to the intake scenarios, the acute and chronic intake scenarios were considered both rational and appropriate assumptions for estimating individual internal doses to large populations from a single WBC measurement result [67].
2. Doses Estimated by the Most Reliable Methodology
The doses based on the most reliable methodology discussed above can be used to estimate the first-year effective doses in the following way. As examples of two affected areas, Namie Town and Iitate Village, effective doses for the first year can be inferred as follows: as the first four-month doses, the Basic Survey results showed that average doses for residents in the two affected areas were around 4 mSv and 1 mSv for all age groups, respectively [14]. Almost all the residents in these areas were evacuated within the first 4 months after the accident. Thus, subsequent doses for them could be inferred from personal dosimeter measurements conducted in non-evacuated areas [25]. Municipality averages were around 0.5 mSv per 3 months in 2011 even in relatively higher ambient dose areas among non-evacuated areas, such as Date City and Nihonmatsu City. Although there remains the uncertainty as to items discussed in previous section, ŌĆ£interpretation of personal dose measurement resultsŌĆØ, the 8-month dose can be roughly inferred as 1.5 mSv from this result. Internal dose due to the acute intake of 134Cs and 137Cs was mostly below 0.1 mSv even for residents in contaminated areas [48, 49].
Thus, the average values for the first-year effective doses for residents in the two affected areas are not likely to reach 10 mSv, the lower end of doses estimated by the WHOŌĆÖs first report appearing in 2012. They would be even lower than the district averages of the UNSCEAR estimations (7.8ŌĆō8.0 mSv for adult evacuees in Iitate Village and 5.0ŌĆō7.0 mSv for adult evacuees in Namie Town, depending on evacuation routes) [4].
For non-evacuated areas, the maximum municipality-average first-year effective dose could be around 3 mSv (4-month external dose, 1.5 mSv; the subsequent 8-month external dose, 1.5 mSv; internal dose due to 134Cs and 137Cs, less than 0.1 mSv). The maximum dose of 3 mSv due to external exposure for non-evacuated areas was consistent with that estimated by the UNSCEAR 2013 Report (adults). The municipality-average internal doses for the first year estimated by UNSCEAR (0.94ŌĆō1.41 mSv, adults in non-evacuated areas) must be overestimated.
3. Future Tasks for Effective Dose Estimation
Since the accident, individual external dose levels in inhabitant areas have changed due to human factors as well as radioactive decay and weathering. For example, (1) decontamination of soil has been conducted in the inhabitant areas in Fukushima Prefecture and (2) some residents in former evacuation areas have begun to return to their hometown. Also, peopleŌĆÖs daily behaviors (occupancy factors) may have changed (or returned to their normal behaviors before the accident) over time. Due to these human factors, individual external doses in a rehabilitation phase cannot be correctly predicted only by model calculations [1, 3, 4] based on deposited radionuclides after the accident. In this respect, monitoring of individual external doses by personal dosimeters is of significance and such results are worthy of publication.
Some of the personal dosimeter/WBC measurements conducted in Fukushima Prefecture (e.g., [23, 24, 50]) have not yet been presented in scientific papers, although residents were notified of their own results and in most cases, all results have been openly available to the residents. These measurements were originally conducted as a healthcare service for the residents. In order to disseminate these data to global scientific communities, however, ethical issues including consensus from residents and municipalities must be overcome.