Recent Trend of Occupational Exposure to Ionizing Radiation in Korea, 2015–2019
Article information

Abstract
Background
Radiation exposure can occur as a result of occupational activities utilizing sources of radiation. The average level of occupational exposure is generally similar to the global average, but some workers receive more than this. In this study, the occupational exposure data for workers in Korea to check the recent trend of radiation exposure.
Materials and Methods
The data collection and analysis are carried out by two separate periods based on the United Nations Scientific Committee on the Effects of Atomic Radiation (UNSCEAR) survey. One is the year 2003 to 2014 for a recent survey, and the other is 2015 to 2019. All available data were collected by annual reports from radiation dose registry organizations.
Results and Discussion
The annual dose over the record level to the total workers did not change much compared with the total increasing number of workers in this period. The dose to the nuclear fuel cycle field has a tendency to decrease. It resulted from the efforts of radiation dose reduction with high technology introduced to this area. Also, it is important result that the radiation dose to the workers in radiography is remarkably reduced.
Conclusion
The number of radiation workers and average doses were analyzed for occupational categories in Korea. It still needs cooperative efforts between the dose registry organizations for the efficient dose management of Korean radiation workers.
Introduction
Radiation exposure can occur as a result of occupational activities utilizing sources of ionizing radiation. It is incurred by workers using radiation or radioactive substances in industry, medicine, education and research, and also by crew during air travel, exposed to cosmic radiation. The average level of occupational exposure is generally similar to the global average level of natural radiation exposure, but some workers receive exposure several times higher than this [1].
The United Nations Scientific Committee on the Effects of Atomic Radiation (UNSCEAR) has periodically reviewed the sources of occupational exposure and estimated distributions of individual annual effective doses and annual collective effective doses from occupational exposure in various industry sectors in accordance with the source types to evaluate prevailing trends in occupational exposure and to identify new worker groups receiving significant radiation doses. Also, it is of particular interest to examine the changes that have taken place over time with the introduction of improved practices, new technology, and/or revised regulations.
Recently, the worldwide occupational exposure data was submitted by the United Nations Member States in response to the UNSCEAR Occupational Exposure Survey for the period 2003–2014. The UNSCEAR began collecting data on occupational exposure due to natural radiation sources in connection with the preparation of the UNSCEAR 2000 Report [2]. Until the implementation of the former International Basic Safety Standards (BSS) [3] in the 1990s, most countries had not been particularly concerned with assessing occupational exposure to natural sources of radiation. Over the past two decades, exposure to enhanced levels of natural radiation has become a focus of attention for radiation protection.
The assessment of occupational exposure by the UNSCEAR due to human-made sources of radiation includes exposure within the subsectors nuclear fuel cycle, medical uses of radiation, industrial uses of radiation, and miscellaneous uses of radiation.
As shown in Table 1, occupational exposure data collected by UNSCEAR survey was categorized into six work sectors with the number of workers and the dose information. One of the work sectors, natural source, enhanced natural radiation exposure to workers such as civilian aviation, coal mining, mineral mining other than coal and uranium, processing of mineral and ores, oil and natural gas industry and radon in workplaces other than mineral extraction were added.

UNSCEAR Questionnaire Categories for International Occupational Exposure Survey
For the nuclear fuel cycle sector, the UNSCEAR requested data on occupational exposure for the same work activities evaluated in its previous reports: uranium mining, uranium milling, uranium conversion and enrichment, fuel fabrication, reactor operation (permanent staff and also contractors), fuel reprocessing, and research in the nuclear fuel cycle. In addition, data were also requested for the subsectors of decommissioning, management of radioactive waste and spent nuclear fuel, safety and safeguard inspections, and transport within the nuclear fuel cycle.
For the medical sector, the identified work activities and division into subsectors are similar to those used in the previous evaluation [1]. Data on occupational exposure in conventional diagnostic radiology and interventional radiology, nuclear medicine, radiation therapy, dental practice, and veterinary medicine were requested. In addition, the data for different work categories (physicians, nurses, technicians, and others) in most work subsectors in medical use of radiation were collected also.
For the industrial sector, the survey collected data and evaluated the level of occupational exposure in industrial irradiation, industrial radiography, luminizing, radioisotope production and distribution, use of industrial gauges, well logging, accelerator operation and all other industrial uses of radiation. These are the same subsectors that were previously evaluated by the UNSCEAR. In each work sector, the number of workers in dose interval and female workers was counted, and the data of average external and internal effective doses were also investigated.
Through the international radiation dose survey, it is important to compare the occupational exposure data with the world average values by work sectors for proper occupational dose management and optimal planning for dose reduction in the view of ALARA (as low as reasonably achievable).
So, in this study, the occupational exposure data for radiation workers in Korea were collected based on the UNSCEAR survey categories and analyzed during the same period 2003 to 2014. In addition, the recent data were also investigated to check the recent trend of radiation exposure.
Materials and Methods
1. Data Collection
In this study, the data collection and analysis are carried out by two separate periods based on the UNSCEAR survey. One is the year 2003 to 2014 for the recent survey, and the other is 2015 to 2019, after the survey. All available data were collected by annual reports from radiation dose registry organizations [4, 5]. Some data requested by the UNSCEAR survey was missing in the annual reports. The missing data in the annual reports were obtained by request for the raw data. Detailed data collection methods by work sectors were described as follows.
2. Nuclear Fuel Cycle Sector
The radiation dose registry for workers in the field of nuclear fuel cycle was managed by the Nuclear Safety and Security Commission (NSSC). The annual report from NSSC includes the most data related to radiation works in Korea. In this report, the radiation dose data of nuclear power, medical (specially radiation therapy), industrial radiography, education, research institute, military and other industry sectors could be obtained.
3. Medical Sector
The radiation dose registry for radiation workers in the field of diagnostic radiology has been initiated by the National Management System in accordance with the Rules for Safety Management of Diagnostic Radiation Emitting Generators (Health and Welfare Enforcement Ordinance 3, published on January 6, 1995).
The annual report includes the average dose in radiation workers by medical institute type, job category, region, and gender, in which the data were extracted from the personal dose database. However, this report excludes the occupational dose data of radiation workers affiliated with nuclear medicine and radiation oncology in the medical and industrial fields. All doses are included in the International System of units and presented to the nearest 100th of a millisievert (1 mSv=100 mrem) as a value indicating the effective dose.
4. Other Industry Sector
As described above, the other sectors except nuclear power and medical were summed for simple comparison. This sector consists of mainly radio-isotopes sales companies, research centers, colleges and universities. But some cases like industrial radiography were treated as a special sector for relatively high average dose.
Results and Discussion
1. Radiation Dose Trend based on Recent UNSCEAR Survey
Fig. 1 shows the total number of radiation workers in Korea during the period 2003 to 2014. The total radiation workers in Korea are still increasing about 113,038 in the year of 2014. This value is about four times greater than those of 2003. The minimum detection level (MDL) is 0.1 mSv, which is also treated as record level. The workers whose radiation dose is more than 0.1 mSv/year are around 40,000 and show the decrease after 2007. Fig. 1 also shows the increase in female workers covering around 30% of total radiation workers.
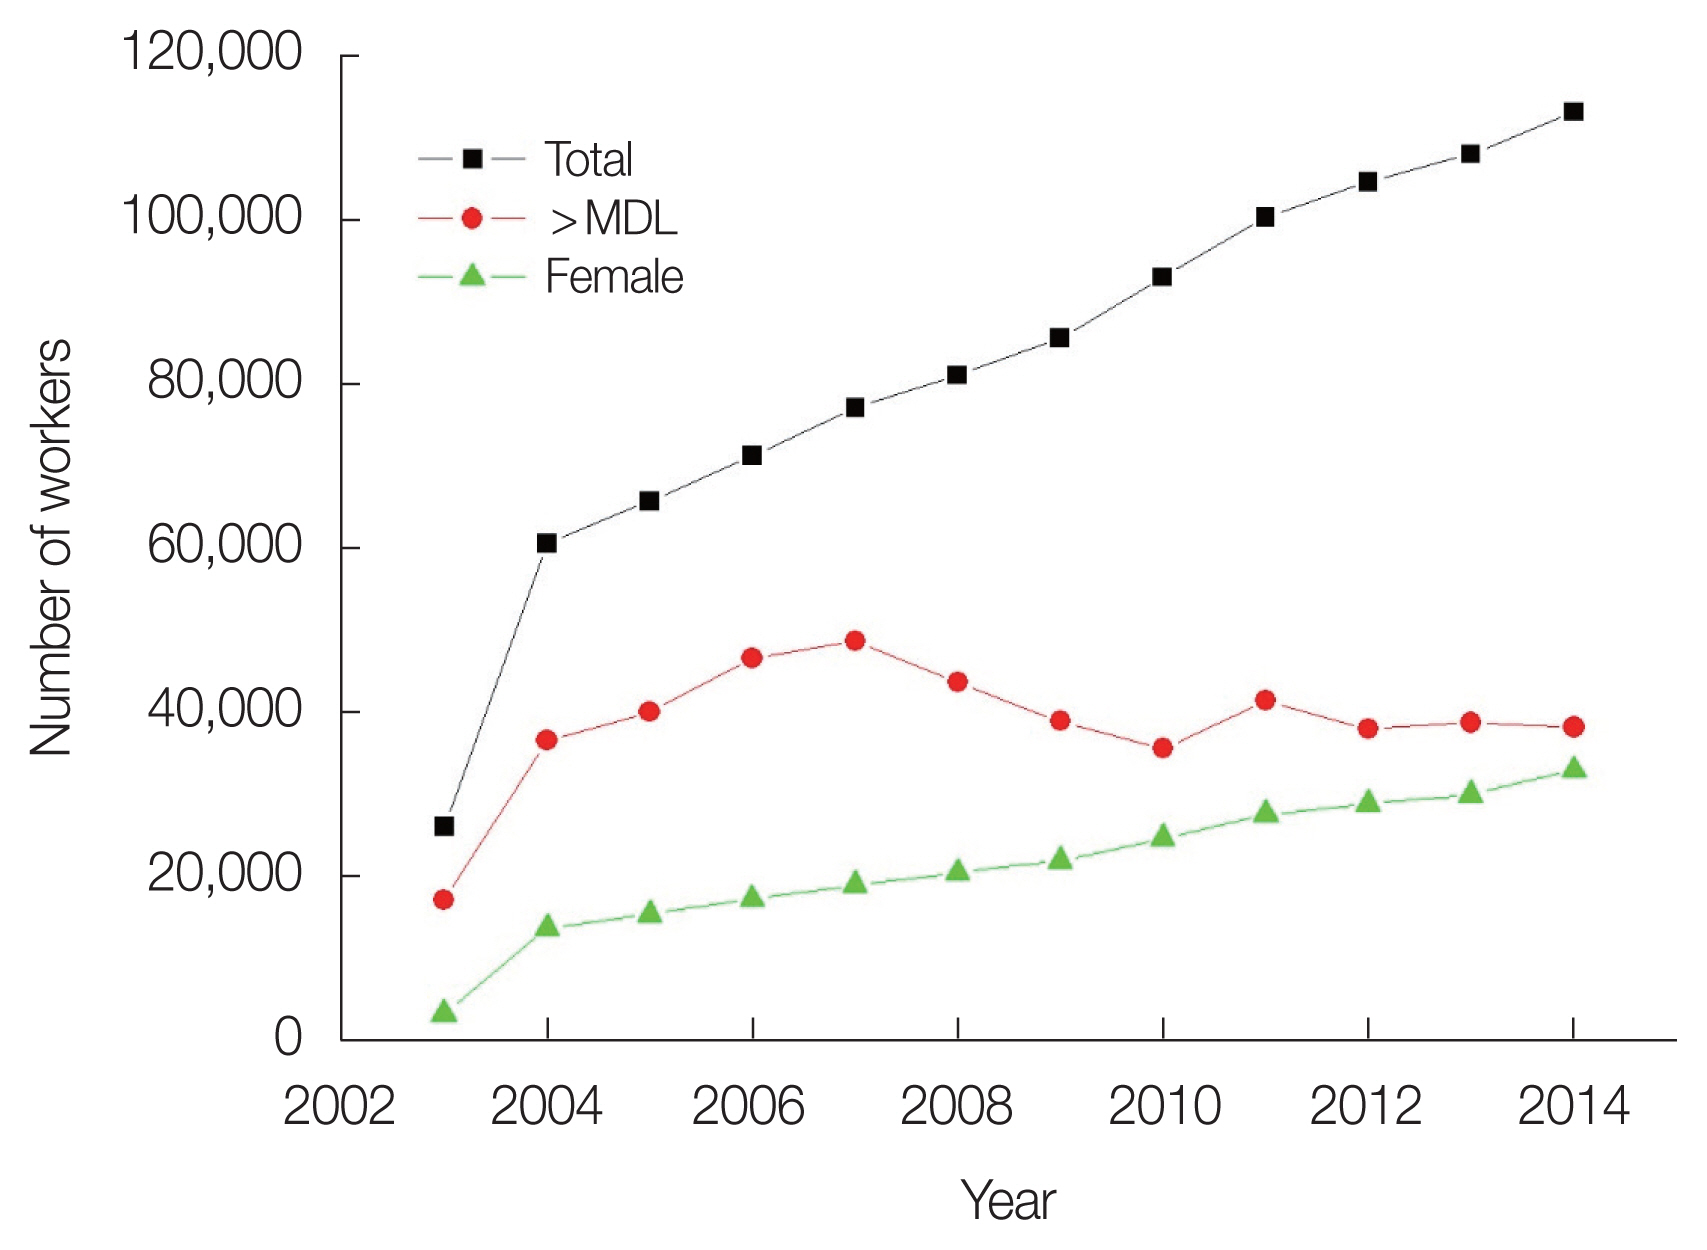
Total number of radiation workers in Korea (2003 to 2014). MDL, minimum detection level.
The number of workers in each sector is shown in Fig. 2. The number of workers in the medical field is still increasing, but the number of other sectors is almost the same. This means the extension of radiation usage is limited only in the medical field.
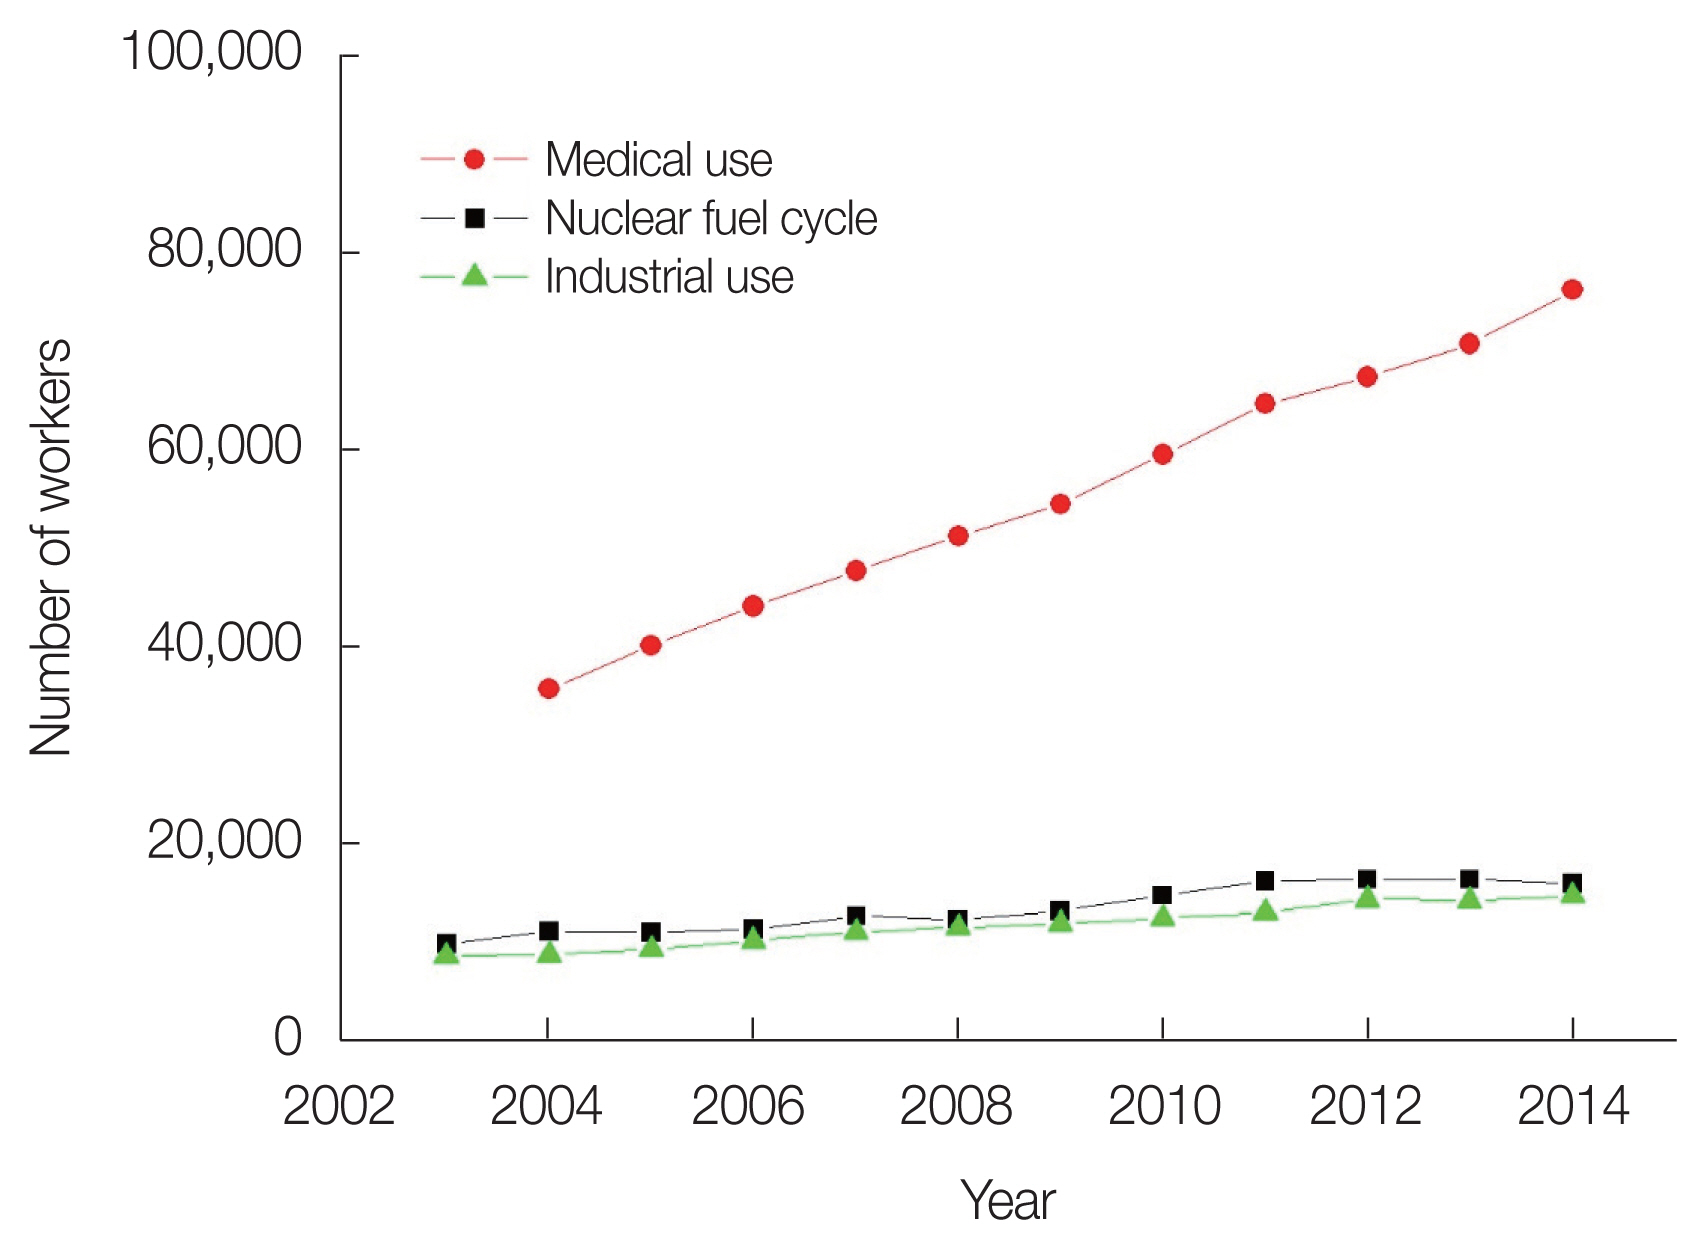
The number of radiation workers by occupational sectors in Korea (2003 to 2014).
The average radiation doses by occupational categories are expressed in Fig. 3. During the period 2003 to 2014, the highest average dose was allocated to radiography by more than 3.0 mSv/yr. The annual dose over the record level to the total workers did not change much compared with the total increasing number of workers in this period. The dose to the nuclear fuel cycle field has a tendency to decrease. It resulted from the efforts of radiation dose reduction with high technology introduced to this area.
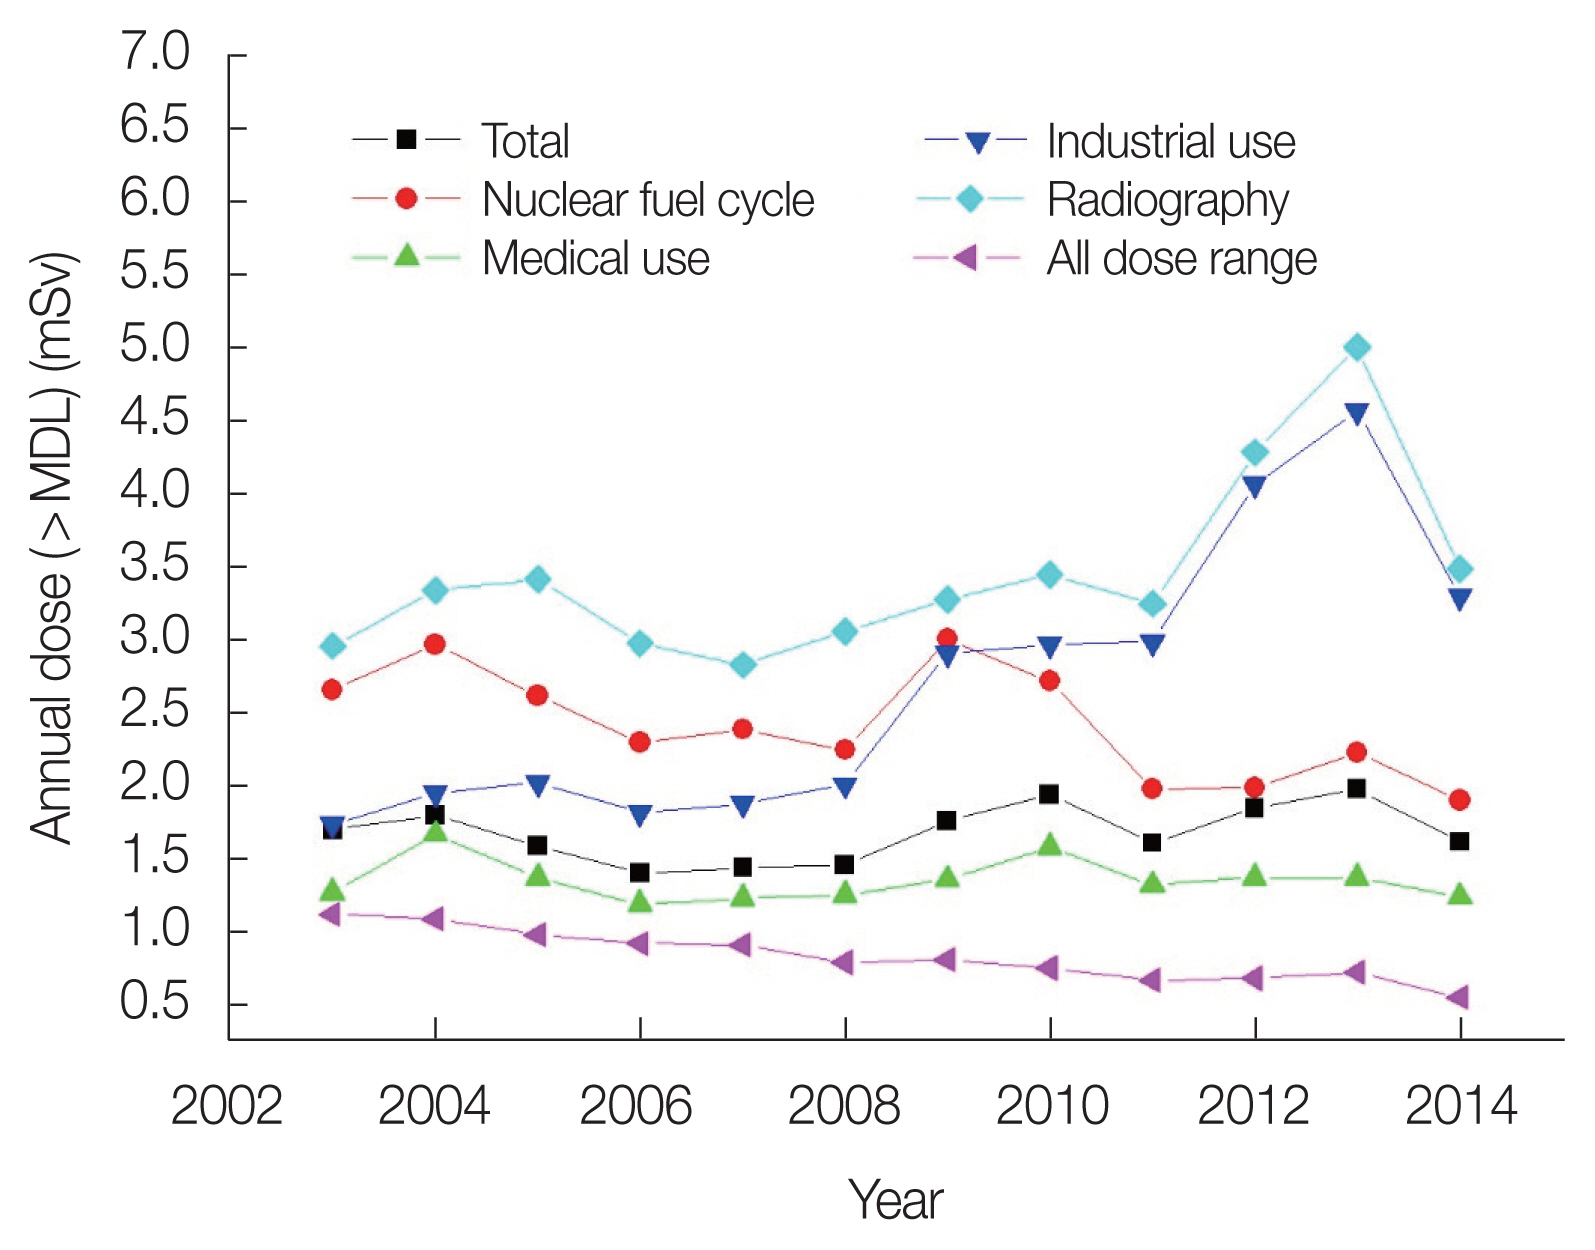
The average radiation doses by occupational categories in Korea (2003 to 2014). MDL, minimum detection level.
2. Recent Dose Trend (2015 to 2019)
In Figs. 4 and 5, radiation dose trend during 2015 to 2019 was shown for occupational categories. There was not much detailed data such as the number of female workers in each work sector like the UNSCEAR survey, but, with the help of two main annual reports, whole radiation workers data could be estimated. Radiation workers in the medical field are still on the trend of increasing. With this increase in the medical field, the total number of radiation workers in Korea were about 150,000 in 2019.
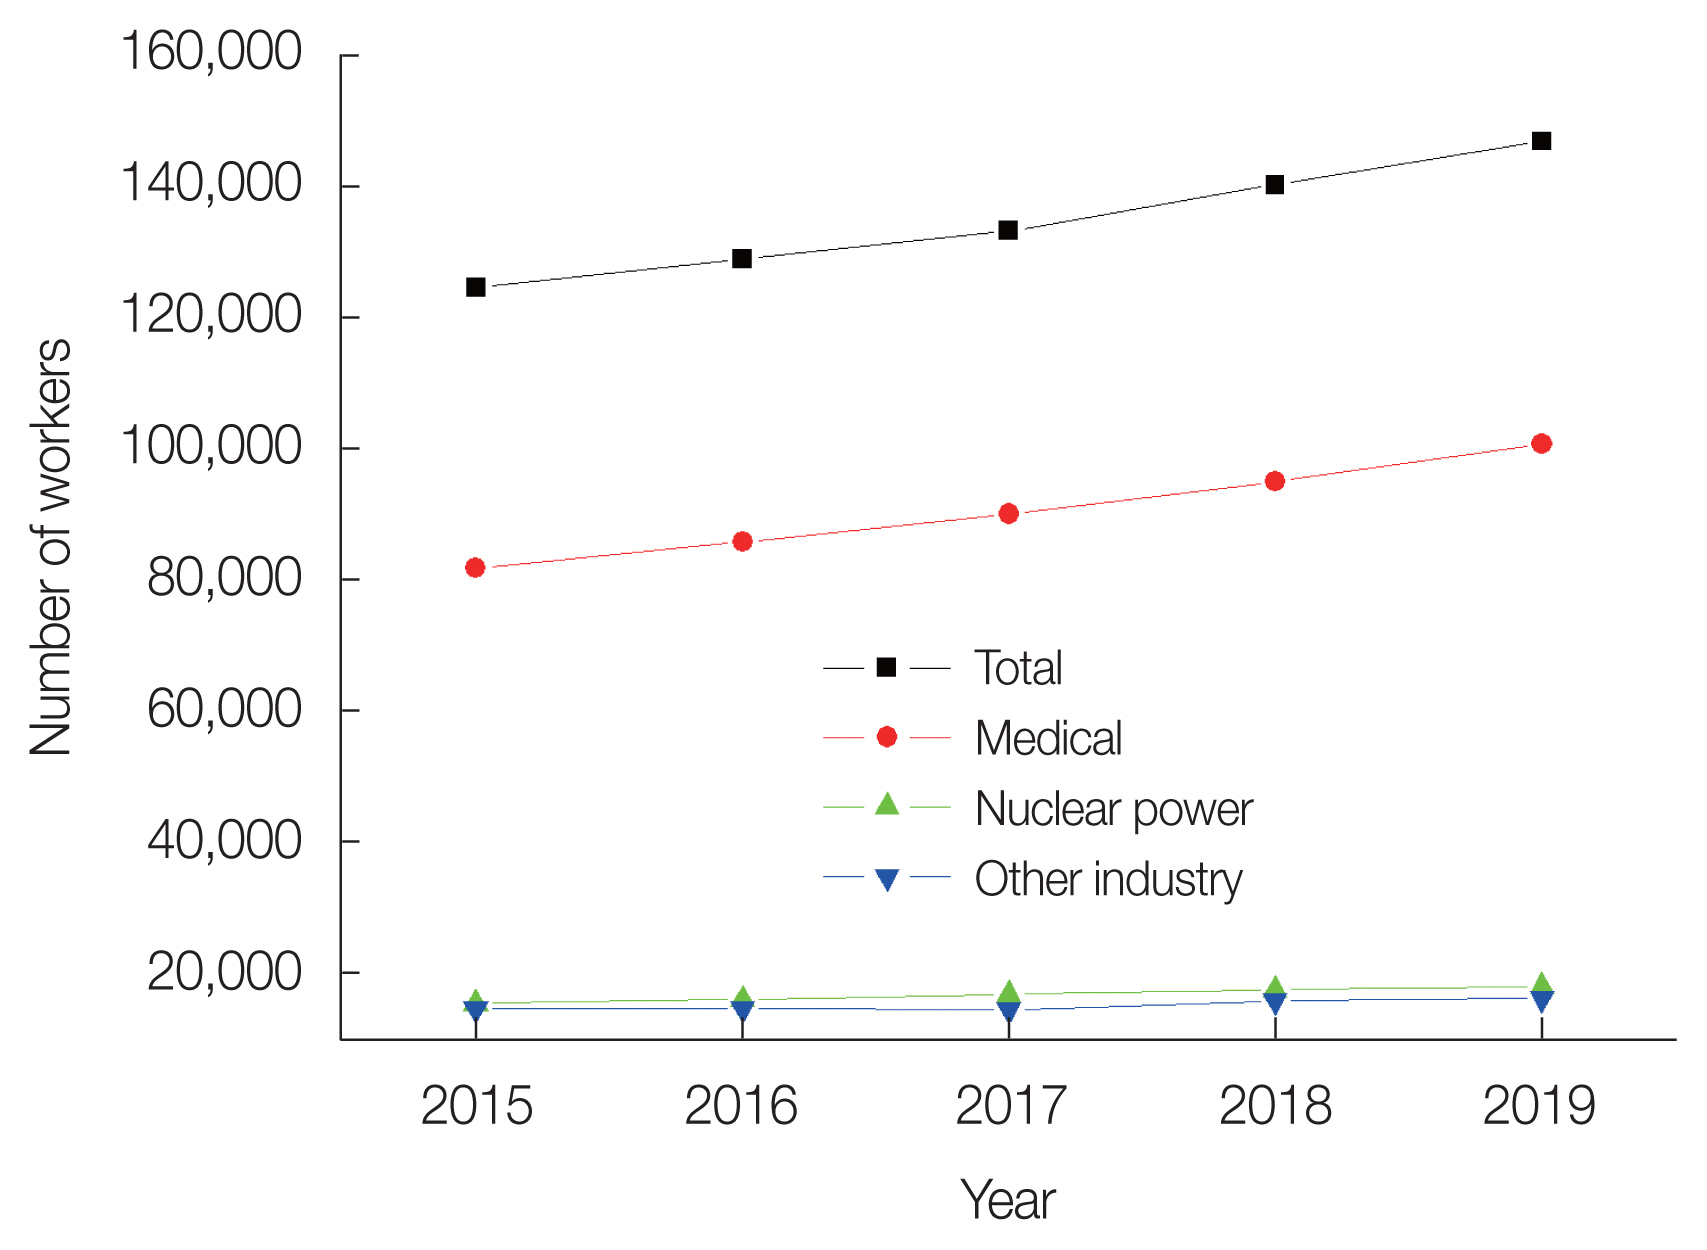
Total number of radiation workers in Korea (2015 to 2019).

The average radiation doses by occupational categories in Korea (2015 to 2019).
It is an especially important result that the radiation dose to the workers in industrial radiography is remarkably reduced. It was considered that some severe accidents in this field made it possible to enhance the regulation. The dose trend of other sectors did not change much and had a tendency to decrease.
Conclusion
The number of radiation workers and average doses were analyzed for occupational categories in Korea. In Korea, occupational radiation doses were managed by several organizations like the NSSC, the Korea Disease Control and Prevention Agency, and the Ministry of Land Infrastructure and Transport. So, there are duplicated registration and different categorizations with the UNSCEAR international survey such as medical subsectors, radiation dose ranges, etc. The number of radiation workers is still increasing but average doses are decreasing. The amount of radiation dose reduction should be checked carefully because the light workers whose dose is relatively small take most of the occupational dose which can lead to misunderstanding. The dose to workers in industrial radiography managed until the year 2015 showed remarkable improvement. It still needs cooperative efforts, such as the establishment of database standards for registered workers, unification of different dose ranges, among the dose registry organizations for the efficient dose management of Korean radiation workers.
Notes
Conflict of Interest
No potential conflict of interest relevant to this article was reported.