

Introduction
In this study we experimentally evaluated the eye lens dose of medical staff from scattered X-ray spectra during therapeutic and diagnostic procedures. It is known that the eye lenses of medical staff are exposed to high equivalent doses of low-energy X-rays [1,2]. Therefore, in order to protect medical staff and comply with the annual dose limit—namely, 20 mSv per year averaged over five consecutive years without exceeding 50 mSv in any single year—additional monitoring of the equivalent dose to the eye lens should be implemented as required [1].
In an ongoing series of investigations, we have been attempting to develop a method for experimentally evaluating the personal dose equivalent for the eye lens, Hp(3), for medical staff. For eye lens monitoring by an appropriate dosimeter, the information about the response of the dosimeter worn close to the eye and the X-rays that medical staff may encounter should be properly collected. The response of the dosimeter is strongly dependent on incident X-ray energy. The mean energy of X-rays to which medical staff are exposed in the region around the eyes is a critical parameter. A mismatch between the response of the dosimeter and the mean energy of X-rays would lead to over/underestimation of the eye lens dose. However, few studies have experimentally investigated the X-ray spectra to which medical staff are exposed during their procedures [3].
The purpose of this study is to clarify how much X-ray energy scattered from the equipment and surroundings used by interventional radiologists (interventional radiology [IVR] practitioners) and computed tomography (CT)-assisting personnel may be irradiated to their lens of the eyes through experiments using a commercially available gamma-ray spectrometer. The X-ray measurements obtained herein are able to help the appropriate calibration of personal dosimeters worn close to the eyes so that they can provide reliable dose. The fluence-averaged energies of scattered X-rays were experimentally derived from the photon fluence rate spectra. The photon fluence spectra were then derived from the pulse height spectra measured by a commercially available CdZnTe (CZT) semiconductor spectrometer [4]. The fluence averaged X-ray energies were estimated from photon fluence spectra by performing the measurement at hospitals and clinics where the exposure to the lens of the eyes is emphasized in typical diagnosis and treatment. The main purpose of this study is to reveal the photon energy spectra of scattered X-rays to which medical staff are exposed from different kinds of diagnostic X-ray equipment using a single measurement method by combining a simple spectrometry and the unfolding method. The experimental determination of the X-ray spectrum directly from an X-ray tube was reported by several researchers by means of the so-called Compton scattering method [5–8]. However, the indirect component from a phantom was not a key focus in the above-mentioned studies. This study focused on the scattered X-rays from patients/examinees because the X-rays observed close to the eye lens of the medical staff during their practices would come from these indirect components, and thus the exposure due to the scattered X-rays should be clarified. The mean energy of the scattered X-ray components is experimentally determined by the half-value layer (HVL) method, which is known to provide accurate average energies. On the other hand, it should be pointed out that the derived absorbed dose conversion coefficient for the reference ionization chamber dosimeter using the effective energy determined by the half-value layer method is different from that determined from the X-ray spectrum [9]. Knowledge about the mean energy and its distribution of the scattered X-ray components is required in order to properly determine Hp(3) for the lens of the eye using a dosimeter. If the appropriate fluence-averaged energies for scattered X-rays could be obtained and applied to derive the proper calibration factors for the dosimeters worn by medical staff, a better estimation of the equivalent doses to the eye lenses could be realized.
Materials and Methods
1. Spectrometry using a CdZnTe Semiconductor Detector
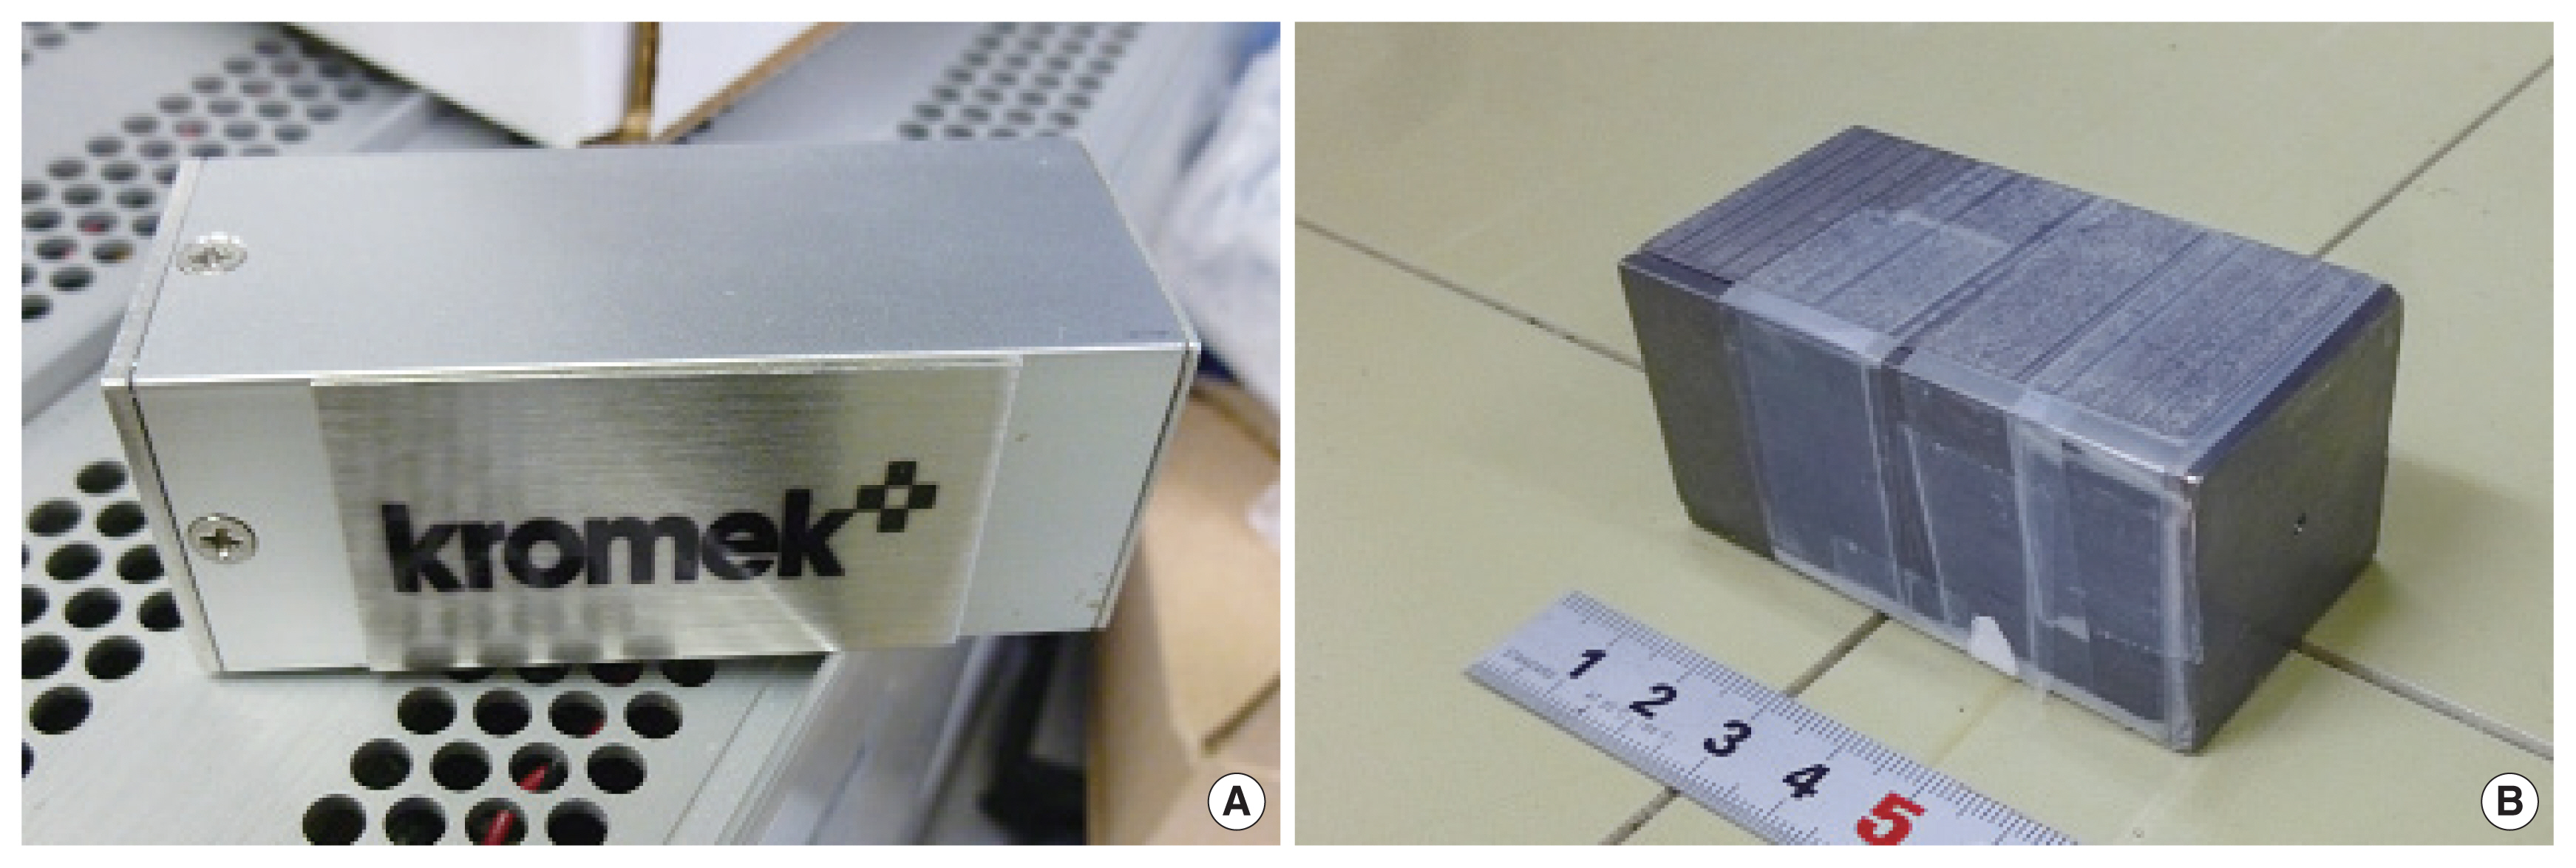
In this study, a small, mobile and simple-to-use CZT semiconductor detector assembly with an analog-to-digital converter (GR1; Kromek, County Durham, UK) [4] was selected for the scattered X-ray measurement. Fig. 1 shows the picture of the CZT detector and the lead collimator. The CZT detector has a 1 cm3 semiconductor crystal. This has been already employed for environmental gamma-ray measurement or other purposes in our research group [10, 11]. Our preliminary measurements suggested the pile-up of the pulse by incoming pulsed X-rays into the CZT detector should be accounted for due to the extremely high dose rate per pulse from the X-ray therapeutic equipment. The lead shielding with copper lining (3-mm-thick lead and 2-mm-thick copper) with a small aperture (1.2 mm in diameter) was designed so that the pile up in the pulse height spectrum could be minimized. To attenuate the X-rays entering the detector, an additional polymethyl methacrylate (PMMA) plate was also introduced in front of the aperture as required.
The photon fluence rate spectrum was evaluated from the pulse height spectrum by employing the unfolding method. The unfolding process is necessary to derive proper photon fluence rate spectrum from the measured pulse height spectrum acquired by the gamma-ray spectrometer. This is because the acquired pulse height spectrum is not a true photon fluence spectrum. This is primarily due to the Compton continuum and the peak broadening according to the characteristics of the detector. The procedure eliminates the above-mentioned influences from the pulse height spectrum and allows us to derive the photon fluence rate spectrum. The photon fluence spectrum was then obtained by de-convoluting the measured pulse height spectra using the MAXED [12] unfolding code.
The matrix of calculated pulse height spectra by the mono-energetic photons was prepared before the measurement for application of the unfolding method. The pulse height spectrum of the CZT detector was calculated using the Monte Carlo (MC) calculation code, MCNP-4C [13]. The geometry of the CZT detector was modelled in detail for the MC calculations, including the lead collimator and the PMMA plate for attenuation. To obtain the matrix of the calculated pulse height spectra with the lead collimator, mono-energetic photons entered from the direction perpendicular to the surface of the detector. The calculated responses of the CZT detector were then broadened according to the energy resolution of the detector which was experimentally determined as a function of the photon energy [8]. The unfolding method was verified in the 241Am reference gamma-ray field established in the Facility of Radiation Standards (FRS) of the Japan Atomic Energy Agency (JAEA) [14].
Fig. 2 shows the 241Am calibration field’s pulse height spectrum and the corresponding photon fluence rate spectrum obtained through the unfolding method [13]. The lead collimator used in the measurements is applied for the measurement by the CZT detector. The nominal activity of the 241Am used is 185 GBq, and the distance from the center of the source to the center of the CZT crystal was set as 2.0 m. The pulse height spectrum obtained by the CZT detector is affected by the interaction inside the CZT detector, and consequently the peak due to the 59.6 keV photons was broadened as shown in Fig. 2A. The pulse height spectrum, therefore, does not give an appropriate mean energy of photons. As shown in Fig. 2B, the peak due to the photons with the energy of 59.6 keV was found to be fine and the influence due to the interaction inside the detector was eliminated by the unfolding process. The unfolding procedure was verified in the energy range around 59.6 keV, which is expected to be equal to the scattered X-ray energies. Even under a heavily collimated situation, a fine peak was also obtained in the photon fluence rate spectrum. It should be noted that the events due to the characteristic X-ray were observed in both the background and the gross spectra, as shown in Fig. 2A. For that reason, the spectrum above around 20 keV was accounted for in the unfolding process in this study.
2. X-Ray Therapeutic and Diagnosis Equipment and Typical Practices
Three different types of X-ray equipment, namely, the CT-scan, the angiography and the fluoroscopy were selected from the viewpoint of high exposure to scattered X-rays as summarized in Table 1. These imaging systems and practices all involve high doses of X-rays to the eye lens, according to a publication from the International Commission on Radiation Protection (ICRP) [1] and findings of several groups [2, 3, 15]. Our own research group revealed that the CT-assisting personnel who assist patients by using the bag-valve mask during the CT scan received significant exposure to the lenses of their eyes. The CT-assisting personnel standed close to a gantry of the CT scan in order to assist the patient lying on a cradle and was thus exposed during patients’ CT examination [16]. Our study revealed that the eye lenses of the intensive care physicians were highly exposed during the procedure [16]. Physicians who perform manipulations with fluoroscopic guidance, especially interventional radiologists and cardiologists, were also subject to exposure of the eye lens [2, 3, 15, 17, 18]. Two procedures with long duration—cardiac angiography and endoscopic retrograde cholangiopancreatography (ERCP)—are representative of the types of procedures that expose the eye lenses of physicians to high doses [19]. In particular, the over-couch fluoroscopic X-ray tube has been disseminated throughout Japan. Some physicians without protective eye glasses may also exceed the annual dose limit of the lens of the eye [19].
3. Measurement of the Scattered X-Ray Components
A series of measurements of the scattered X-rays was performed for three different types of X-ray equipment, namely, the CT-scan, the angiography and the fluoroscopy. The pulse height spectra from the CZT detector were measured at the positions where a medical staff would actually engage in his/her procedure or treatment. An appropriate phantom was chosen for simulating a patient and a medical staff, according to the type of equipment and procedure. The CZT detector with the lead collimator was set at the height of the position of the left eye (158 or 165 cm, according to the apparatus) of the medical staff to evaluate the scattered X-ray components directly entering the eye. The measurement and imaging conditions for each equipment were summarized in Table 2. According to the intensity of the scattered X-ray components, an additional PMMA-filter was set in front of the aperture of the lead collimator to improve the measurement conditions. To obtain the major components of the scattered X-rays from patients or examinees, the lead collimator with the small aperture was always positioned so as to face the center of the phantom which simulated the patient/examinee. Our preliminary study of the CT scan indicated that the intensities of the scattered X-ray components from the floor, the cradle, and the gantry accounted for 2.5%–3.1% of total dose rates directly reaching the CZT spectrometer. The photon fluence rate spectra of the scattered X-ray components were then derived by decomposing the pulse height spectra using the unfolding code MAXED [19].
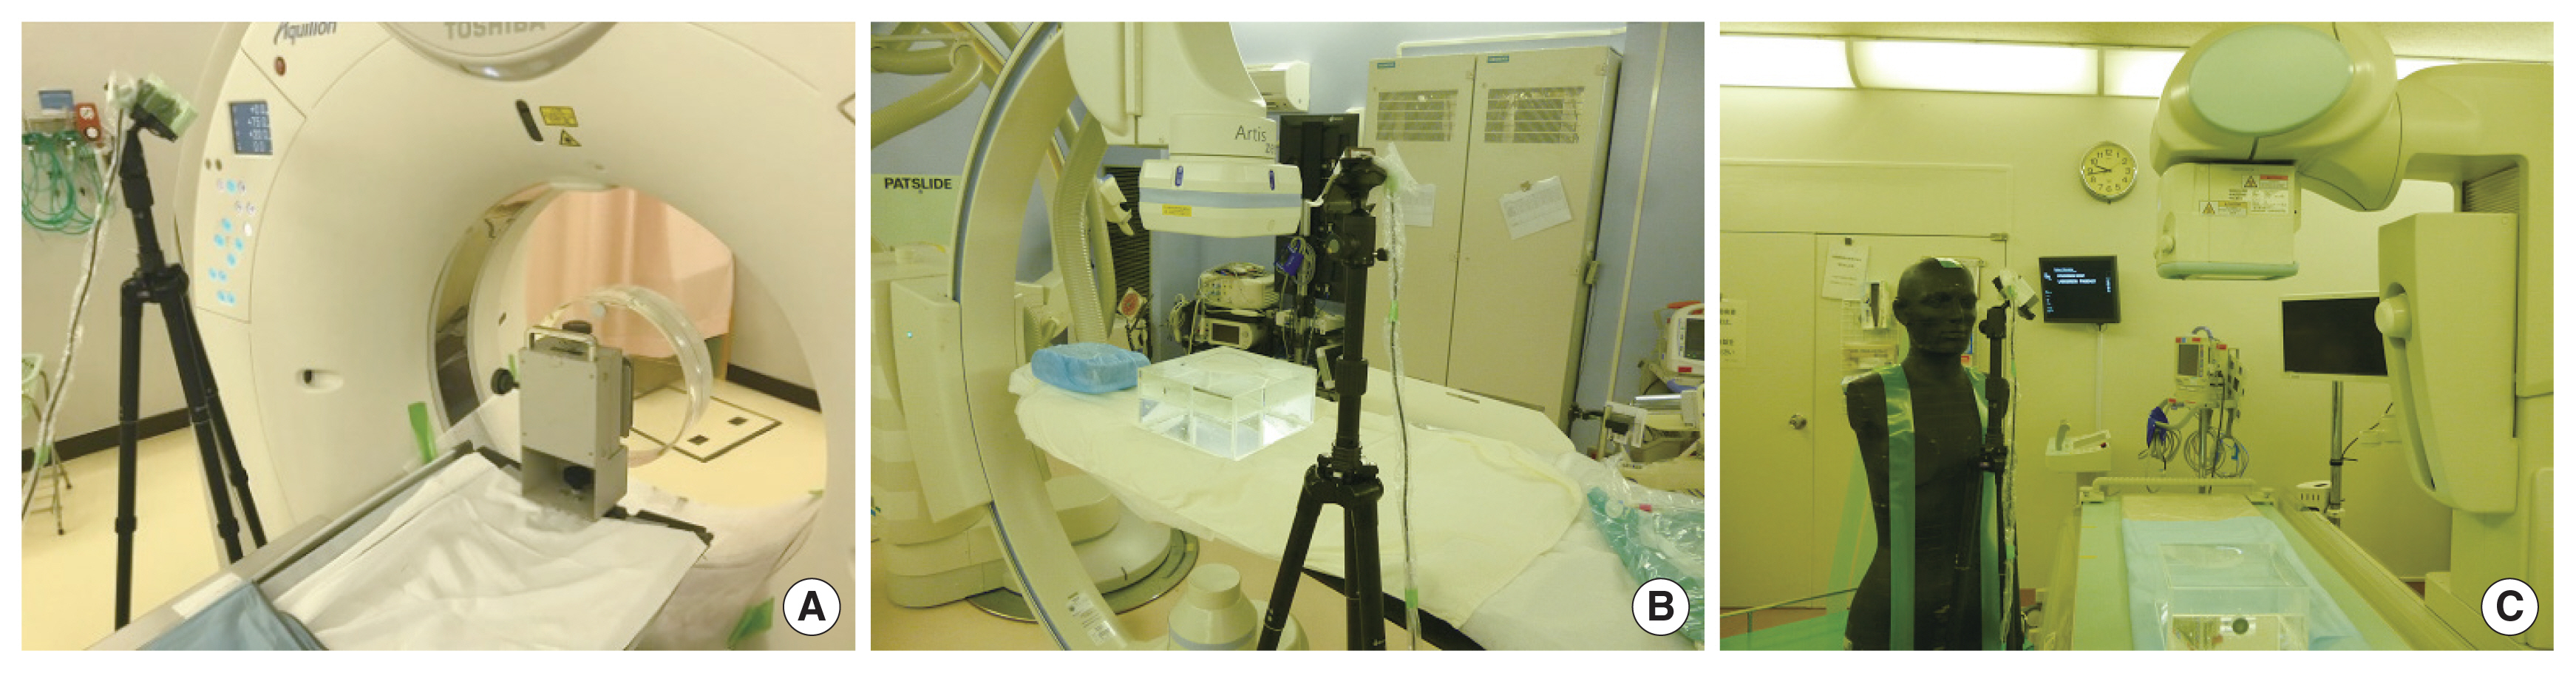
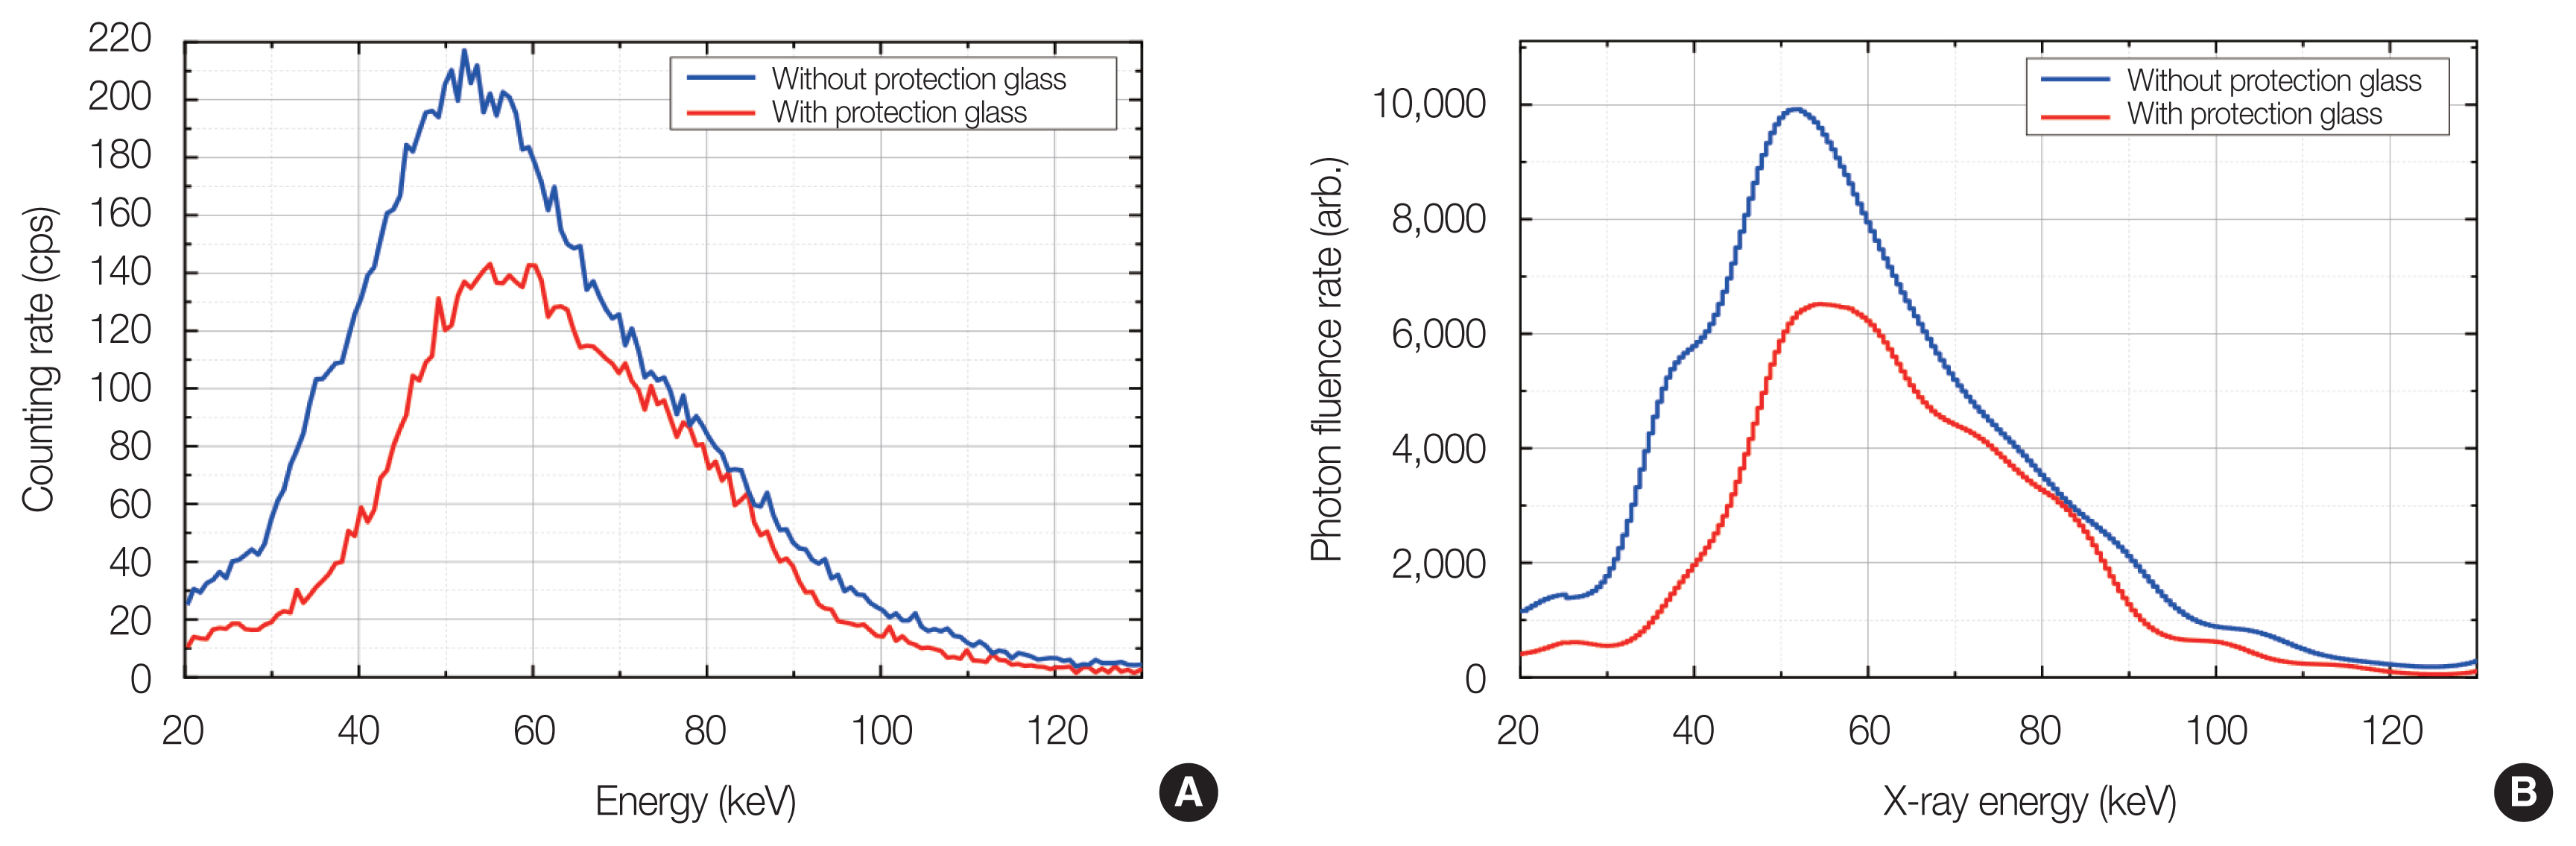
As for the exposure of medical staff from the CT scan, scattered X-ray components were measured at the position close to the gantry where the CT-assisting personnel assists his/her patient. As shown in Fig. 3A, the CZT detector was set at the left side of the gantry of the CT scan using the tripod. The measurement position was selected so that the maximum intensity of the scattered X-ray from the CT head phantom could be observed. For the CT scan examinee, the height of the CZT detector was set at the eye height (158 cm from the floor) of the CT-assisting personnel. The distance from the CZT detector to the center of the CT head phantom set inside the gantry was 92 cm. The CZT detector with the lead collimator was positioned to face the direction of the CT head phantom. The angle to the horizontal was set at −45° (downward) and the angle to the axis of the cradle was set at 45° (to the CT scan). In addition to the scattered X-ray component measurement, the attenuation by a protective lead glass was experimentally investigated by comparing the intensities obtained with and without of the protection glass set in front of the aperture of the lead collimator.
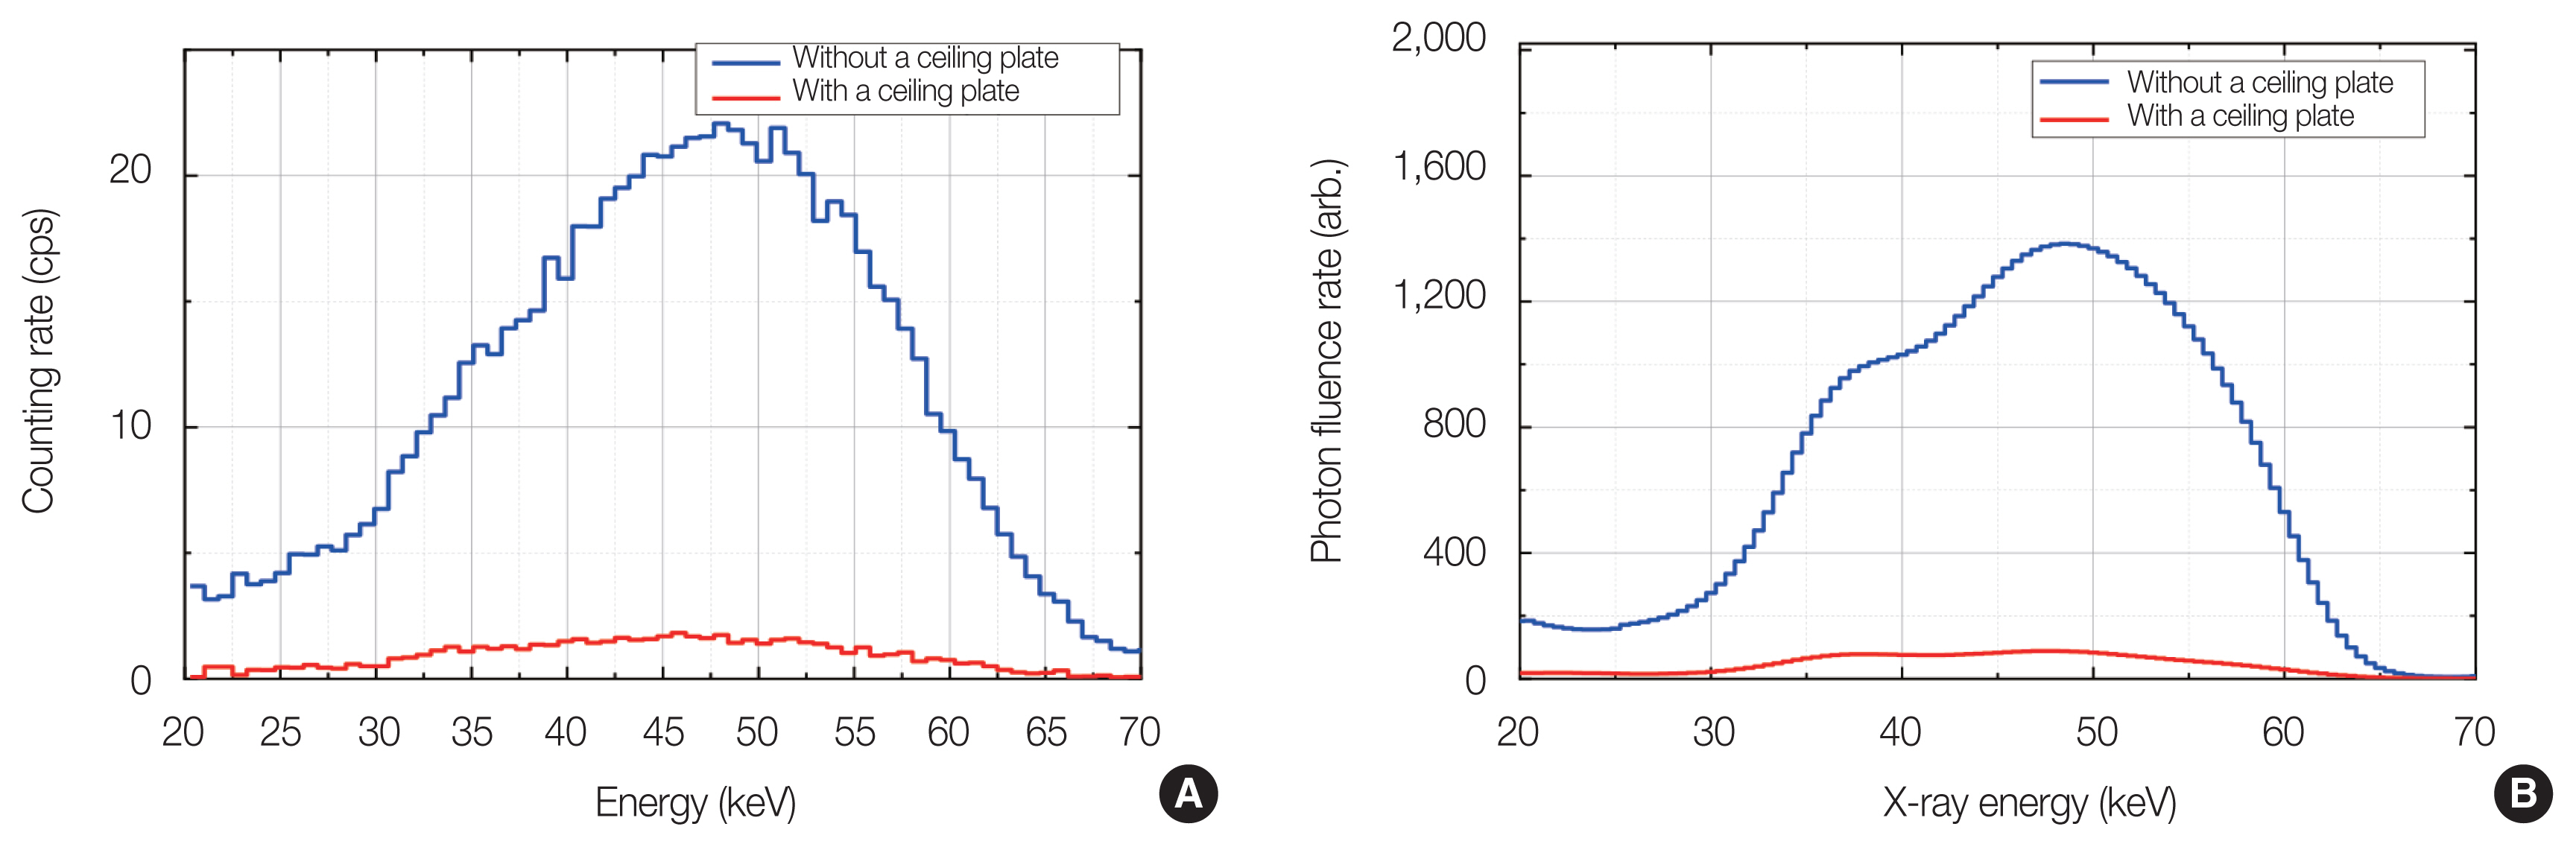
Measurement of the scattered X-ray components from the patient during the cardiac angiography procedure was performed using a PMMA-made water-filled phantom (ISO water phantom) with dimensions of 30×30×15 cm3. Fig. 3B shows the experimental setup of the measurement of the scattered X-rays from the angiography. Using the tripod, the CZT detector with the lead collimator was set at the position of physician standing in front of the monitor to mimic the physician. The height of the detector was set at the eye height (158 cm from the floor) of the physician. The detector was positioned to face the center of the phantom to obtain the highest intensity of the scattered X-rays from the phantom. Distance from the detector to the center of the phantom was 84 cm. For angiography measurement, both imaging and diagnosis mode were accounted for. The difference of the mean energy of the scattered X-ray components for each condition was experimentally evaluated. The X-ray irradiation conditions are summarized in Table 2 as well. The attenuation of the intensity of the scattered X-rays due to the introduction of the ceiling plate was also experimentally investigated.
The scattered X-rays from the patient in the fluoroscopic procedure were also conducted using the ISO water phantom. As shown in Fig. 3C, the CZT detector with the lead collimator was set at the position of the physician in front of the patient to reproduce the exposure condition during the ERCP procedure. The height of the detector was set at the eye height (165 cm from the floor) of the physician. The detector was positioned to face the surface of the phantom, and the distance from the detector to the surface of the phantom was 82 cm (eye height). The angles of the aperture to the horizontal were set at −45° (downward: eye position) and 0° (direct to the X-ray tube). This was due to the difference in the mean energies of scattered X-ray components entering from different scattering sources, i.e., from the X-ray tube shielding and from the actual patient.
Results and Discussion
1. Measured Pulse Height Spectra and X-Ray Fluence Rate Spectra of the Scattered X-Ray Components
1) CT scan
Fig. 4 shows the pulse height and photon fluence rate spectra of the scattered X-rays from the CT scan. The imaging condition was described in Table 2. Fig. 4 also shows the spectra obtained under the condition where a protective lead glass (HF-380B; Toray Medical Co. Ltd., Tokyo, Japan) was set in front of the aperture of the lead collimator. The attenuated spectrum was properly measured throughout the experiment. The obtained photon spectrum without the lead glass has a peak around 50 keV. This is quite consistent with the calculated spectra obtained by Platten [20]. This also supports that our procedure taken in this study was reasonable.
2) Angiography
As shown in Fig. 5, the pulse height spectra and the corresponding photon fluence rate spectra were measured at the position of the physician’s eye during the angiography procedures. Several studies have reported that the appropriate introduction of a ceiling-suspended shield significantly reduced the scattered X-rays from the patient [3, 18, 21]. In the present study as well, the use of a ceiling plate between the ISO water phantom and the CZT detector drastically reduced the scattered X-rays reaching the measurement position.
3) Fluoroscopy
The scattered X-ray components from the patient were measured as shown in Fig. 6. The measurement of the pulse height spectrum from the patient during the fluoroscopic procedure was performed by setting the CZT detector at the height of the physician. Two different directions of the detector were chosen for investigation: (1) −45° to the direction of the ISO water phantom and (2) horizontal (0°) to the X-ray tube of the equipment. Fig. 6 shows that the effective shielding of the X-ray tube prevented the scattered components from the tube itself.
2. Mean Energy of the Scattered X-Ray Components
The purpose of this study was to evaluate the mean energy and its energy range of the scattered X-rays which medical staff may be exposed to in the course of their practice. Table 3 shows the comparison of the mean energy of X-rays by photon fluence rate spectra and averaged energy obtained from the pulse height spectra for each piece of X-ray equipment. The uncertainties of the mean energies of scattered X-rays for each piece of equipment were estimated by considering the deviations between the calculated values obtained by the estimated fluence rate from the unfolding method and the measured counting rate of the original pulse height spectra from the CZT spectrometer. The averaged energy of the pulse height spectra of the CZT spectrometer was derived by calculating the sum of the counting errors of each channel of the pulse height spectra. The mean energy of X-rays of the scattered X-ray components were determined to range between 40 and 60 keV for the three different types of X-ray equipment, namely, CT-scan, angiography and fluoroscopy. Note that evaluated the mean energy of X-rays would be higher than those obtained under ideal conditions, because the photons having energy below 20 keV were not accounted for due to the overlapping of the events from the characteristic X-rays from cadmium.
The significant features of this study are that (1) it focused on the energy spectrum measurement of the X-ray components, scattered from the patient and the medical equipment to the eye lenses of the medical staff, and (2) the mean energy of X-rays of the scattered X-ray components was determined by a method other than the HVL method. The energy spectrum measurement has been reported to determine the direct X-ray components from the CT scan and diagnostic X-ray equipment using the Compton scattering method [5–8]. The direct component from the X-ray tube is to be reconstructed from the measured scattering component, and the scattering component itself is not the object of evaluation. In this study, however, we sought to evaluate the scattered X-ray components that medical staff may receive close to their eyes. The scattered X-rays from the patient/examinee itself are thought to be predominant among the scattered X-rays observed from the measurement. The mean energy of the scattered X-rays can be obtained for the scattered X-ray components by the HVL method, which has been used by our research group. The mean energy of X-rays evaluated for the CT scan was determined to be 55.74 keV using an ionization chamber. This was found to be in good agreement with the value obtained through spectrometry, considering the differences in the measurement condition, the measurement methods, and the methods used to obtain the mean energy of X-rays in this study. On the other hand, it is difficult to determine the distribution of scattered X-rays by means of the HVL method. In this study, the mean energies and distributions of scattered X-rays were obtained simultaneously to obtain proper readings from the dosimeters worn near the eyes of medical staff.
Our observation of X-rays scattered from the angiography equipment seems reasonable, considering the results obtained by Masterson et al. [18]. The difference in the tube voltage applied may have led to a higher the mean energy of X-rays. The tube voltage applied in this study (65 kVp) was higher than that used in the study performed in [18]. In Masterson et al., the peak shifted higher as the tube voltage increased from 60 to 74 kVp. The thicker the introduced copper filter was, the higher energy peak observed in the pulse height spectra was [18]. In the angiography measurements, the mean energy of X-rays between the imaging and diagnosis mode were also estimated to be 45 and 46 keV, respectively. On the contrary, differences in the tube current also would have affected the variation of the mean energy of X-rays.
The results also imply that the averaged energy from the pulse height spectrum was almost identical to that from the photon fluence rate spectrum. This suggests that pulse height spectrum would be a practical parameter to characterize the scattered X-ray component in various exposure situations in the medical practices. The unfolding process necessitates a proper knowledge of the response of the spectrometer and sophisticated methods requiring a high level of skill. As a result, it may not always be possible to obtain immediate results of the mean energies of X-rays from the evaluated photon fluence rate spectra. In contrast, the use of the multichannel analyzer (MCA) in the spectrometry allows an immediate comparison of the measured pulse height spectra and enables calculation of the mean energy if the energy calibration were properly made. This will help the systematic investigation of the mean energies obtained under various exposure conditions, such as under different positions, postures, and procedures/protocols, using different types of the equipment, and so on.
3. Variation in the Mean Energy of the Scattered X-Ray Components due to Shielding
Tables 4 and 5 show the variation of the mean energies of X-rays due to the shielding in the CT-scan and the angiography. For CT-scan measurement, the protective lead glass was set in front of the lead collimator to mimic the X-rays which the CT-assisting personnel may encounter during medical procedures with the ventilation using the bag-valve mask. In Table 4, the the corresponding photon fluence rate obtained under each condition are listed. Uncertainties of the estimated fluence rates of scattered X-rays were also derived from the deviations between the estimated counting rate obtained by the unfolding method and the measured values for each channel of the pulse height spectra. It should be noted that the values do not reflect the correct air kerma rate at the measurement position, because the lead collimator introduced limits scattered X-rays entering the CZT detector. The mean energies of X-rays turned out to be little affected by the use the protective lead glass. This implies that the same calibration factor is applicable to obtain the correct values of Hp(3) from dosimeters worn under the protective lead glass. The shielding effect of the protection glass was estimated to be 0.64 from the nominal intensities obtained from the pulse height spectra. This was in good agreement with that obtained in our previous study, which ranged between 0.49 and 0.69 [16]. Almost identical results (51.3±22.0%) were also obtained for the case of physicians who are engaged in ERCP [19]. Table 5 shows the variation of the mean energies of X-rays with and without the introduction of the ceiling-suspended shield in angiography. The corresponding intensities of photon fluence rate obtained under each condition are also summarized. The results of the mean energies of X-rays also indicated that the attenuation of scattered X-ray components due to the ceiling-suspended shield had little effect. The ratio of the intensity of the scattered X-ray component was estimated to be 0.067. This is also consistent with the dose reduction factor by introducing the ceiling-suspended shield [21].
Table 6 shows the variation of the mean energies of X-rays at the eye height at different angles in the fluoroscopy procedure. The intensities of photon fluence rate evaluated under each measurement condition are also listed in Table 6. The mean energy of X-rays obtained at the horizontal position was higher than those obtained from the condition of downward setting (−45° toward the center of the phantom). Uncertainties of the estimated fluence rates of scattered X-rays were derived in the same manner as described above. The uncertainties accompanying the scattered X-ray fluence rates and the mean energy of X-rays were estimated by considering the deviations between the estimated counting rate obtained from the unfolding method and the measured values for each channel of the pulse height spectra. The X-ray tube of the fluoroscopy is well shielded to limit excess exposure to X-rays leaking from the tube. Such shielding would affect the attenuation of scattered X-rays entering directly from the tube. On the other hand, the scattered X-rays from the patient reach the position of the physician’s eye without the shield. The higher the mean energy of X-rays obtained under the horizontal setting might be explained by the shielding of the tube. The ratio of the intensity of the scattered X-ray component was estimated to be 0.1. This finding supports that the accumulated count from the pulse height spectrum reflects the intensity of the scattered X-ray component reaching the CZT detector. By comparing the counts obtained under various exposure situations, the effect of attenuation can be systematically investigated through the spectrometry using a commercially available CZT detector, without requiring the complicated measurement system.
4. Applicability to Clinical Practice
Regarding the usefulness of this method in an actual clinical setting, the measurement of the scattered X-ray components using commercially available spectrometers and phantoms which mimic the examinee and the practitioner for each piece of equipment and each piece of procedure will be beneficial from the viewpoint of protecting medical staff from radiation exposure. The measurement of scattered X-rays will allow the proper determination of dose distributions and the identification of their energy spectra within the actual operating room. The radiation protection officer in hospitals and clinics can judge whether the readings from the dosimeter worn close to the eye lens need to be corrected. The information about dose distributions and their energy spectra will also help radiation protection officers in hospitals and clinics carry out countermeasures to reduce the doses that medical staff may receive during medical procedures. This will keep doses to the eye lenses of the medical staff low. In these cases, the unfolding process for obtaining the X-ray energy spectra after measurements might be omitted.
Conclusion
The authors evaluated the X-rays scattered from X-ray therapeutic and diagnostic equipment to which medical staff received during their procedures by carrying out a measurement protocol using a commercially available CZT semiconductor spectrometer with a lead collimator. By decomposing the pulse height spectra, the photon fluence rate spectra of scattered X-rays were experimentally evaluated. The measured spectra were thought to be consistent with the measured and calculated results of other researchers. From the obtained spectra, the mean energies of the scattered X-rays were found to cover between 40 and 60 keV. The mean energies of X-rays also agreed with those measured by means of the conventional HVL method or values obtained from other researchers. This strongly supports the effectiveness of this method for obtaining an appropriate calibration factor of the glass dosimeter for routine monitoring of the eye lens doses of medical staff. In the comparison of the mean energies of X-rays obtained with and without shielding by a protective lead glass and a ceiling-suspended plate, the evaluated the mean energies of X-rays were not significantly changed. The areas of pulse height spectra from the CZT detector reflect the intensity of the scattered X-ray components. By introducing the multi-detector measurements with the collimators, detailed information about the scattered X-rays can be systematically accumulated to better understand the big picture of the scattered X-rays encountered during medical procedures.