Bias-corrected Hp(10)-to-Organ-Absorbed Dose Conversion Coefficients for the Epidemiological Study of Korean Radiation Workers
Article information
Abstract
Background
The effects of radiation on the health of radiation workers who are constantly susceptible to occupational exposure must be assessed based on an accurate and reliable reconstruction of organ-absorbed doses that can be calculated using personal dosimeter readings measured as Hp(10) and dose conversion coefficients. However, the data used in the dose reconstruction contain significant biases arising from the lack of reality and could result in an inaccurate measure of organ-absorbed doses. Therefore, this study quantified the biases involved in organ dose reconstruction and calculated the bias-corrected Hp(10)-to-organ-absorbed dose coefficients for the use in epidemiological studies of Korean radiation workers.
Materials and Methods
Two major biases were considered: (a) the bias in Hp(10) arising from the difference between the dosimeter calibration geometry and the actual exposure geometry, and (b) the bias in air kerma-to-Hp(10) conversion coefficients resulting from geometric differences between the human body and slab phantom. The biases were quantified by implementing personal dosimeters on the slab and human phantoms coupled with a Monte Carlo method and considered to calculate the bias-corrected Hp(10)-to-organ-absorbed dose conversion coefficients.
Results and Discussion
The bias in Hp(10) was significant for large incident angles and low energies (e.g., 0.32 for right lateral at 218 keV), whereas the bias in dose coefficients was significant for the posteroanterior (PA) geometry only (e.g., 0.79 at 218 keV). The bias-corrected Hp(10)-to-organ-absorbed dose conversion coefficients derived in this study were up to 3.09-fold greater than those from the International Commission on Radiological Protection publications without considering the biases.
Conclusion
The obtained results will aid future studies in assessing the health effects of occupational exposure of Korean radiation workers. The bias-corrected dose coefficients of this study can be used to calculate organ doses for Korean radiation workers based on personal dose records.
Introduction
Radiation workers are constantly susceptible to occupational exposure. Thus, the assessment of the radiation effect on health has become important because of increasing concerns about protracted exposure. Previous studies generally used the personal dose equivalent Hp(10) to evaluate the health effects associated with occupational exposure. Similar to other countries, the occupational exposure of Korean radiation workers is managed in terms of Hp(10), measured by personal dosimeters such as the thermoluminescent dosimeter (TLD), and the measured Hp(10) values are reported every 3 months to the national dose registry.
However, to evaluate cancer morbidity and mortality, the International Commission on Radiological Protection (ICRP) strongly recommends the use of an organ-absorbed dose rather than Hp(10) [1]. Unfortunately, it is impossible to directly measure organ-absorbed doses because dosimeters should not be inserted into the human body. For this reason, organ-absorbed doses for radiation workers should be derived from Hp(10) values using dose conversion coefficients. The ICRP has provided the dose conversion coefficients for air kerma-to-Hp(10) and air kerma-to-organ-absorbed doses calculated based on a 30 cm×30 cm×15 cm slab phantom (mass composition: 76.2% oxygen, 11.1% carbon, 10.1% hydrogen, and 2.6% nitrogen) and anthropomorphic phantoms coupled with Monte Carlo methods [2, 3], respectively. Accordingly, the organ-absorbed dose can be calculated by converting Hp(10) using the aforementioned dose conversion coefficients.
However, several biases affect the reliability and validity of the risk assessment of occupational exposure in the reconstruction of the organ-absorbed dose. First, a bias in the recorded Hp(10) occurs during the calibration and reading of personal dosimeters. Although personal dosimeters are practically exposed to radiation from various directions in addition to having different angular dependencies depending on the incident angle, the exposure geometry, except the anteroposterior (AP), is ignored in the existing calibration and reading procedure. In addition, the slab phantom used for calibration is not similar to the human body, where an actual personal dosimeter is positioned. Therefore, the accuracy of the recorded Hp(10) varies with exposure conditions and calibration geometry. The calibration procedure of a personal dosimeter can introduce bias in the recorded Hp(10) because the angular dependency and the differences between the slab phantom and the human body are not considered.
Furthermore, an important bias is introduced while deriving organ-absorbed doses from recorded Hp(10) through the ICRP air kerma-to-Hp(10) conversion coefficients. The ICRP air kerma-to-Hp(10) conversion coefficients are derived from a cuboid slab phantom. However, in actual practice, Hp(10) is measured using a personal dosimeter worn on a radiation worker’s body, not a slab phantom. Therefore, differences exist between the actual measurement geometry of Hp(10) and the slab phantom-based calibration geometry that are used to calculate the conversion coefficients. These differences introduce bias in the estimation of air kerma from recorded Hp(10) and consequently affect the derivation of organ-absorbed doses. For example, for exposure from the posteroanterior (PA) direction, the attenuation thickness for the human body is typically expected to be higher than 200 mm, whereas that for a slab phantom is only 140 mm, according to the definition of Hp(10). In this case, although the recorded Hp(10) is measured after being attenuated by the human body, only the attenuation by the slab phantom is considered in the air kerma calculations. Therefore, the calculated air kerma is underestimated, which means that the organ-absorbed dose is underestimated. For these reasons, to improve the validity of the estimated organ-absorbed doses, it is necessary to analyze biases that affect dose conversions.
In this study, we attempted to quantify the biases introduced into the recorded Hp(10) and subsequently into the slab phantom-based conversion coefficients (air kerma-to-Hp(10)) to finally derive the organ-absorbed dose for radiation workers. For this purpose, a Monte Carlo simulation of the dosimeter measurement coupled with the slab and the anthropomorphic phantoms was performed.
Materials and Methods
1. Background of Organ-Absorbed Dose Reconstruction
An organ-absorbed dose can be reconstructed from recorded Hp(10) as follows:
where DT is the tissue or organ-absorbed dose (Gy); Hp(10) is the personal dose equivalent at a depth of 10 mm (Sv); Hp(10)/Ka is the air kerma-to-Hp(10) conversion coefficient (Sv/Gy); and DT/Ka is the air kerma-to-organ-absorbed dose conversion coefficient (Gy/Gy).
The two conversion coefficients (i.e., Hp(10)/Ka and DT/Ka) are determined according to the exposure scenarios (energy and geometry) to which radiation workers are exposed. ICRP Hp(10)/Ka values calculated based on a slab phantom according to the photon energy and the incident angle are provided in Table A.24 of ICRP Publication 74 [2]. DT/Ka can be calculated based on simulations using computational human phantoms. ICRP has provided reference DT/Ka values calculated based on the ICRP reference voxel phantom [3]. Computation was performed according to idealized geometries: AP, PA, right lateral (RLAT), left lateral (LLAT), rotational (ROT), and isotropic (ISO) [3]. The cranial-caudal and caudal-cranial geometries introduced in the US National Council on Radiation Protection and Measurements (NCRP) report were also considered in this study [4].
2. Bias in Organ Dose Reconstruction
Two types of biases were considered in this study: the bias B1 in the recorded Hp(10) and the bias B2 in Hp(10)/Ka. B1 arises because the response of the personal dosimeter under the current calibration conditions (i.e., the irradiation in the AP direction and the use of the slab phantom) may differ that under the actual exposure conditions. Therefore, B1 can be quantified using the ratio of the dosimeter response under the irradiation on the anthropomorphic phantom at the incident angle α to that under the irradiation on a slab phantom at 0°. In addition, the difference in reference Hp(10) (i.e., the value used as the correction factor for calibration) introduced by the differences between the calibration geometry (AP) and actual exposure geometry is also considered.
where R(E, α)human denotes the dosimeter response on the anthropomorphic phantom irradiated at an incident angle α; R(E, 0°)slab denotes the dosimeter response on the slab phantom irradiated at 0° (AP); Hp(10; E, α)human denotes the Hp(10) values depending on the actual exposure energy and geometry; and Hp(10; E, 0°)slab denotes the Hp(10) values for AP geometry, which have been provided by ICRP. More specifically, to quantify the response R with Monte Carlo simulation, R was defined as the absorbed dose delivered to the element of the personal dosimeter per unit of air kerma.
Another bias, B2, can also be quantified by comparing the conversion coefficients based on the anthropomorphic and slab phantoms. Because this bias involved in the dose conversion coefficients results from the geometric differences between the human body and the slab phantom, B2 is defined as follows:
where (Hp(10)/Ka)human is the anthropomorphic phantom-based Hp(10)/Ka, and (Hp(10)/Ka)slab is the slab phantom-based Hp(10)/Ka, which have been provided by ICRP.
3. Monte Carlo Simulation for Bias Estimation
In the quantification of the biases, we used the Korean Typical Man-2 (KTMAN-2) computational phantom constructed from high-resolution anatomical images of Koreans to minimize the physical differences between Korean radiation workers and the anthropomorphic phantom. KTMAN-2 is a computed tomography image-based voxel phantom consisting of 300×150×344 voxels with a resolution of 2 mm×2 mm× 5 mm [5]. KTMAN-2 was implemented based on the Monte Carlo N-Particle 6 (MCNP 6) code. The field size was defined as 50 cm×60 cm for AP, PA, RLAT, and LLAT geometries and 60 cm×80 cm for the cranial-caudal and caudal-cranial geometries; the size was considered sufficient to approximately model whole-body irradiation. In the LAT geometry (i.e., an incident angle of 90°), because a depth of 10 mm cannot be defined, the Hp(10) value cannot be defined. Therefore, the response was calculated with an incident angle of 75° [4]. For the same reason, the cranial-caudal and caudal-cranial geometries were also exposed at 75°. The responses for ROT and ISO geometries were calculated by averaging those for four geometries (AP, PA, LLAT, and RLAT) and six geometries (AP, PA, LLAT, RLAT, cranial-caudal, and caudal-cranial), respectively.
To calculate B1 from the relative response of a TLD, personal dosimeters on the slab and KTMAN-2 phantom (Fig. 1) were modeled after the Panasonic TLD UD-802 model (Panasonic Corporation, Tokyo, Japan), which is commonly used in radiation facilities in Korea. TLD UD-802 measured Hp(10) using a 0.05-mm thick thermoluminescent material (CaSO4) and a 1 g·cm−2 filter made of lead and plastic. The absorbed doses in the CaSO4 element were calculated using the energy deposition (type F6) tally for AP, PA, RLAT, LLAT, cranial-caudal, and caudal-cranial geometries. Thus, the relative response was calculated as the ratio of the absorbed dose in the CaSO4 element on the KTMAN-2 to that on the slab phantom. To confine the statistical error of the simulation result within 5%, 108–109 histories were used. The position of the personal dosimeter worn on the front was selected as 14.4 cm below the thyroid gland and 4 cm left from the midline, where it is commonly worn [6].

Transverse plane images of personal dosimeter implemented in Monte Carlo N-Particle 6 (MCNP6) code for the calculation of B1 with the slab phantom (A) and with Korean Typical Man-2 (KTMAN-2) (B).
The bias estimation was performed for energies of 218, 397, and 662 keV, suggested as representative exposure energies for Korean radiation workers [7]. The use of these energies facilitates proper interpolation of the biases over a wide energy range.
Hp(10; E, α)human in equation (2) was calculated based on a tissue equivalent material of 30 cm×30 cm×2 cm positioned on the chest of the KTMAN-2. The cuboidal material is the same as that of the slab phantom, and its thickness was selected in consideration of the filter thickness of TLD. The absorbed dose was tallied in a cylindrical cell (thickness of 0.01 cm; diameter of 1 cm) defined at a depth of 10 mm (Fig. 2).
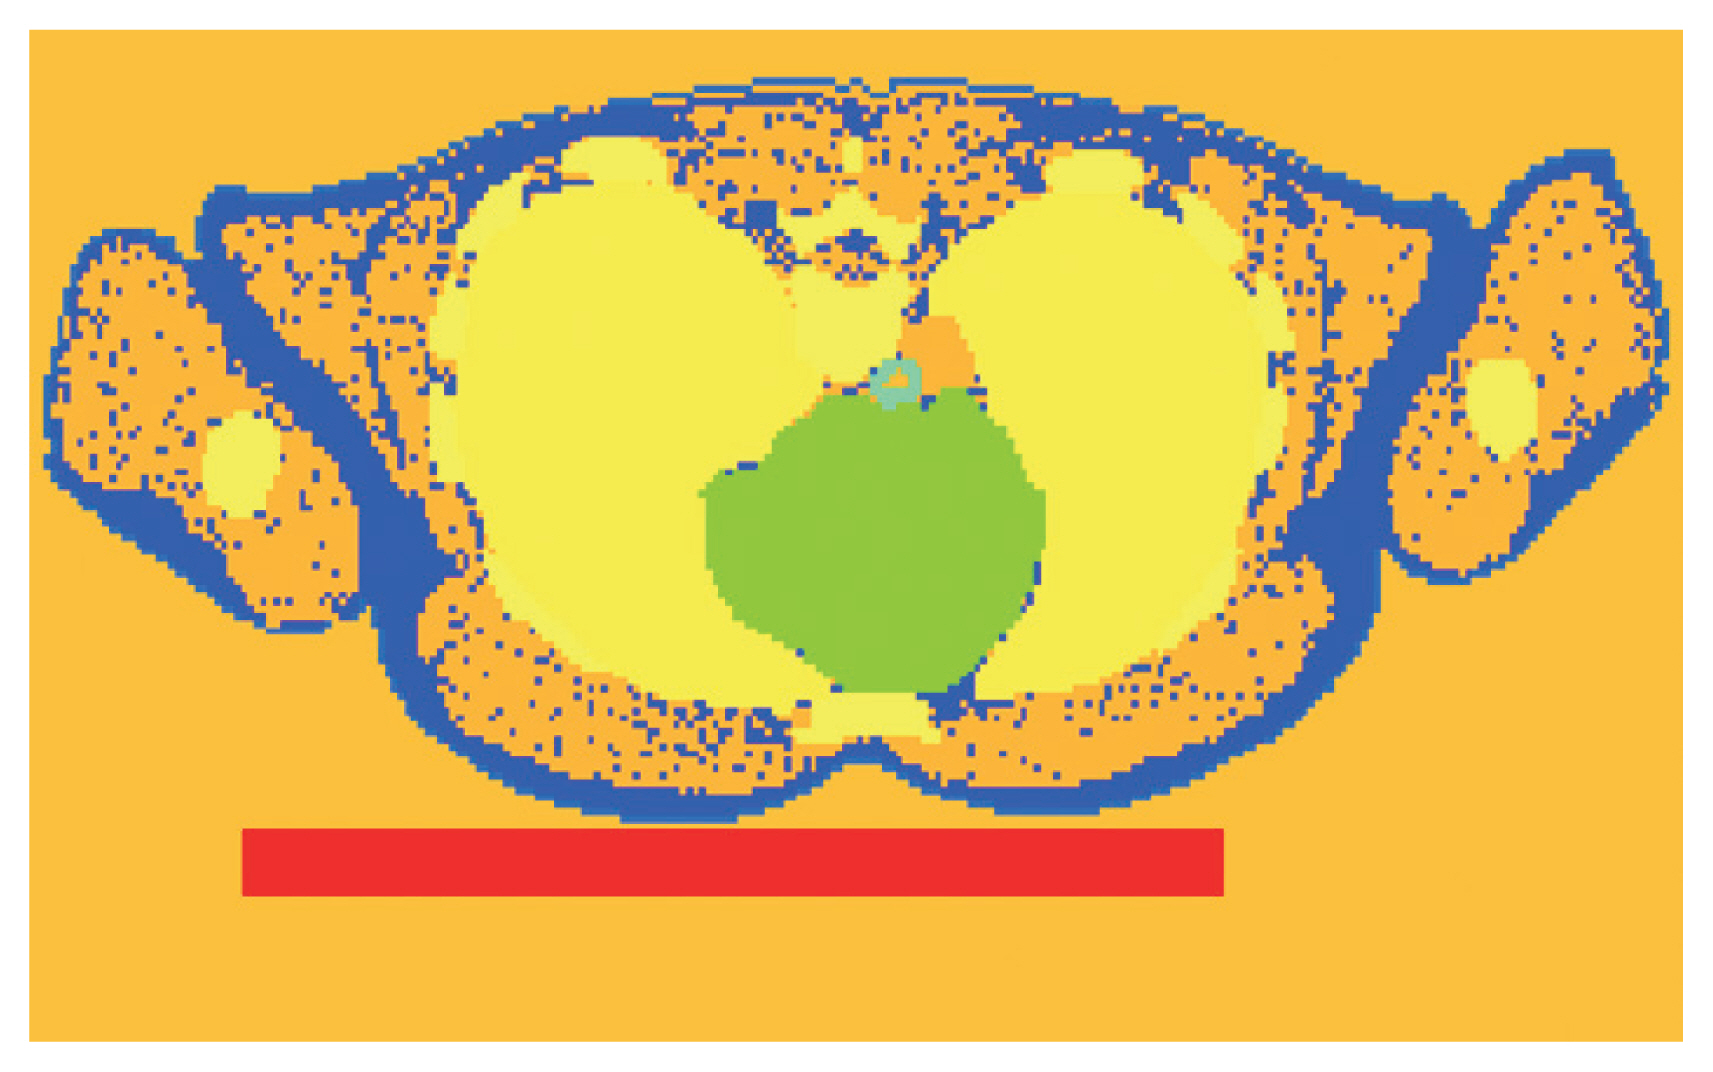
Transverse plane image of cuboid tissue equivalent material (red) and Korean Typical Man-2 (KTMAN-2) implemented in Monte Carlo N-Particle 6 (MCNP6) code for the calculation of of Hp(10; E, α)human.
To estimate B2, Hp(10) was calculated in the same manner as B1 (Fig. 2), and the air kerma values based on energy were calculated using the fluence-to-air kerma conversion coefficients provided in Table A.1 of the ICRU Report 47 [8]. B2 was calculated as the ratio of the Hp(10)/Ka obtained in this simulation to that provided in the ICRP Publication 74 [2].
4. Calculation of Bias-Corrected Hp(10)-to-Organ-Absorbed Dose Conversion Coefficients
For use in epidemiological studies, bias-corrected Hp(10)-to-organ-absorbed dose conversion coefficients are derived by considering the two types of biases in this study and are expressed as follows:
where DT/Hp(10) is the Hp(10)-to-organ-absorbed dose conversion coefficient and DT/Ka is the air kerma-to-organ-absorbed dose conversion coefficient. We used (Hp(10)/Ka)slab values provided in the ICRP Publication 74 and DT/Ka values calculated using mesh-type reference computational phantoms (MRCPs) developed based on the ICRP reference anatomical data [2, 9].
Results and Discussion
1. Simulation Verification
To verify the bias estimation method, the Hp(10) values on the slab phantom were calculated using MCNP 6, and Hp(10)/Ka values were compared with those of ICRP Publication 74 [2]. The Hp(10) values were calculated in a cylindrical cell with a thickness of 0.01 cm and diameter of 1 cm, in the same manner as the bias calculations. The radiation field size was selected as 50 cm×60 cm, and the fluence was 3.3× 10⁻⁴ cm−2. The photon energies ranged from 0.03 keV to 10 MeV, and 108 histories were considered. The Hp(10)/Ka from this study and ICRP are presented in Table 1, and the differences were within 5% for all energies.

Results of Verification for the Bias Estimation Method
2. Quantified Biases
The quantified biases are shown in Table 2. The B1 values, depending on the incident angle, were calculated considering the angular dependency of the personal dosimeter and differences between the slab and KTMAN-2 phantom. In AP geometry, B1 for all energies is approximately 1, which means that the geometric differences between the two phantoms are not significant. For the AP geometry (i.e., 0°), the angular dependency is not considered in the quantification of B1. However, although Hp(10; E, α)human values are typically smaller than Hp(10; E, 0°)slab values for all energies and geometries, the B1 values for lower energies were observed to be noticeably smaller than 1, except for the AP geometry. In addition, the magnitude of bias (i.e., the difference from 1) is larger at low energies; for example, B1 for RLAT was 0.32 and 0.97 at 218 and 662 keV, respectively. This is because the attenuation of the incident radiation in TLD is larger for longer attenuation distances and lower energies, resulting in a relatively low response. The radiation entering the lead and plastic filters should travel longer distances as the incident angle increases. In the case of ROT and ISO geometries, the B1 values, calculated by weighting those of other geometries, were considerably larger than those for the 75° directions (i.e., RLAT, LLAT, cranial-caudal, and caudal-cranial) because of the effects of the AP geometries.

Biases Calculated by Monte Carlo Simulation Depending on Energy and Geometry
B2 is close to 1 for all energies and geometries except for the PA geometry, i.e., 0.79 and 0.88 at 218 keV and 662 keV, respectively. As expected, the attenuation thickness of KTMAN-2 was higher than 200 mm, whereas that of the slab phantom was only 140 mm. Therefore, the absorbed dose per unit of air kerma calculated based on KTMAN-2 was smaller than that calculated based on the slab phantom. Consequently, the calculated B2 was also smaller in the PA geometry.
3. Hp(10)-to-Organ-Absorbed Dose Conversion Coefficients
For use in epidemiological studies, a library of bias-corrected Hp(10)-to-organ-absorbed dose conversion coefficients, DT/Hp(10), was created for three energy points, six geometries, and 30 organs (28 organs for each sex) using the biases derived in the current study and the dose coefficients provided by ICRP. The full data are tabulated in Appendices A and B. DT/Hp(10) values for energy points between the energies considered in this study can be derived by interpolation. Tables 3 and 4 show example dose conversion coefficients for adult male and female phantoms for five major organs with a tissue weighting factor of 0.12 (i.e., red bone marrow, colon, lungs, stomach, and breasts). Although most organs are exposed to the highest doses in the AP direction, the bias-corrected DT/Hp(10) values were greatest in the PA direction due to the significantly greater biases.
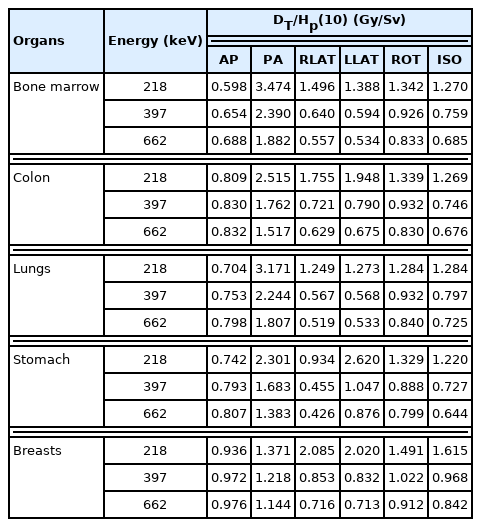
DT/Hp(10) Conversion Coefficients with Biases Considered: Male

DT/Hp(10) Conversion Coefficients with Biases Considered: Female
The practical impact of the biases on dose reconstruction can be assessed by DT/Hp(10). Ratios of DT/Hp(10) derived in the current study to those from ICRP publications without considering the biases are shown in Table 5. Note that the differences in dose conversion coefficients arise only from the biases, and thus the ratios are equal in all organ dose coefficients. For the AP direction, the biases in the dose coefficients do not have a significant impact on the dose reconstruction. Nevertheless, the ratios (this study/ICRP) vary by exposure scenario and range from 0.98 to 3.09 for three energies and six geometries. The greatest difference in DT/Hp(10) was observed in the case of the exposure energy of 218 keV and RLAT geometry (3.09), indicating that the consideration of the biases derived in this study can result in 3.09-fold higher organ doses than those calculated using ICRP reference dose coefficients without considering the biases.

Ratios of Hp(10)-to-Organ-Absorbed Dose Conversion Coefficients, DT/Hp(10), Derived in This Study to Those from ICRP Publications
The differences in DT/Hp(10) have a significant implication for dose reconstructions for Korean industrial radiographers, whose cumulative Hp(10) is highest among all Korean radiation workers [10]. In practice, an industrial radiographer who places an image film can be exposed with PA direction because the acquisition of radiographic images usually begins on the way back to the shielded area (this information was gathered in a personal conversation). In this case (i.e., 397 keV and PA direction), organ doses calculated considering the biases can be 1.53-fold higher than those without considering the biases.
Conclusion
In this study, two types of biases in organ-absorbed dose reconstruction were quantified using Monte Carlo simulations. The study demonstrated that the bias B1, caused by personal dosimeters and calibration geometries, increases when the incident angle is large or the exposure energy is low, and B2 is approximately 1, except for the PA geometry, which has a large difference in attenuation thickness between anthropomorphic and slab phantoms. The findings of this study indicate that the biases in Hp(10) and dose coefficients (Hp(10)/Ka) can result in a significant underestimation of a radiation worker’s dose and thus should be considered in the dose reconstruction. Moreover, this study might be used as a framework for the detailed analysis and reliable assessment of the organ-absorbed dose from occupational exposure. The application of the quantified biases to other epidemiological studies, based on new scenarios and methods, will widen the prospects of this study and is therefore of significant interest for future research.
Acknowledgements
This work was supported by a grant given to the Korea Institute of Radiological and Medical Sciences (KIRAMS), funded by Nuclear Safety and Security Commission (NSSC), Republic of Korea (No. 50091-2021) and by Korea Institute of Energy Technology Evaluation and Planning (KETEP) grant funded by the Korea government (MOTIE) (20214000000070, Promoting of expert for energy industry advancement in the field of radiation technology).
Notes
Conflict of Interest
No potential conflict of interest relevant to this article was reported.
Author Contribution
Conceptualization: Jeong A, Kwon TE. Methodology: Jeong A, Kwon TE, Lee W. Formal analysis: Jeong A, Kwon TE. Project administration: Park S. Visualization: Jeong A. Writing - original draft: Jeong A. Writing - review and editing: Kwon TE. Approval of final manuscript: all authors.
References
Appendices
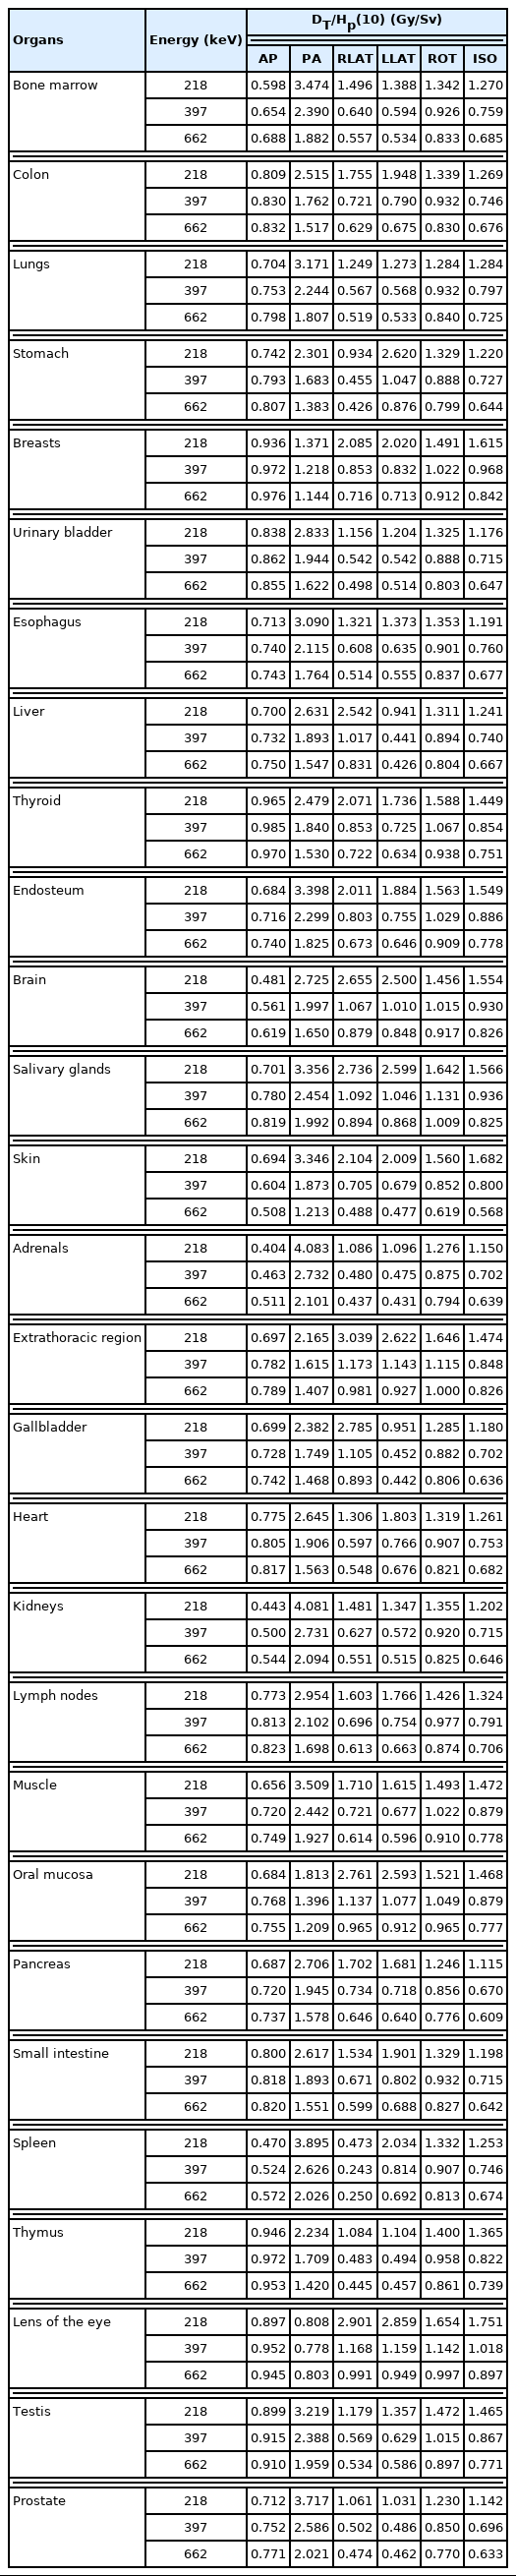
Bias-Corrected DT/Hp(10) Conversion Coefficients for Male
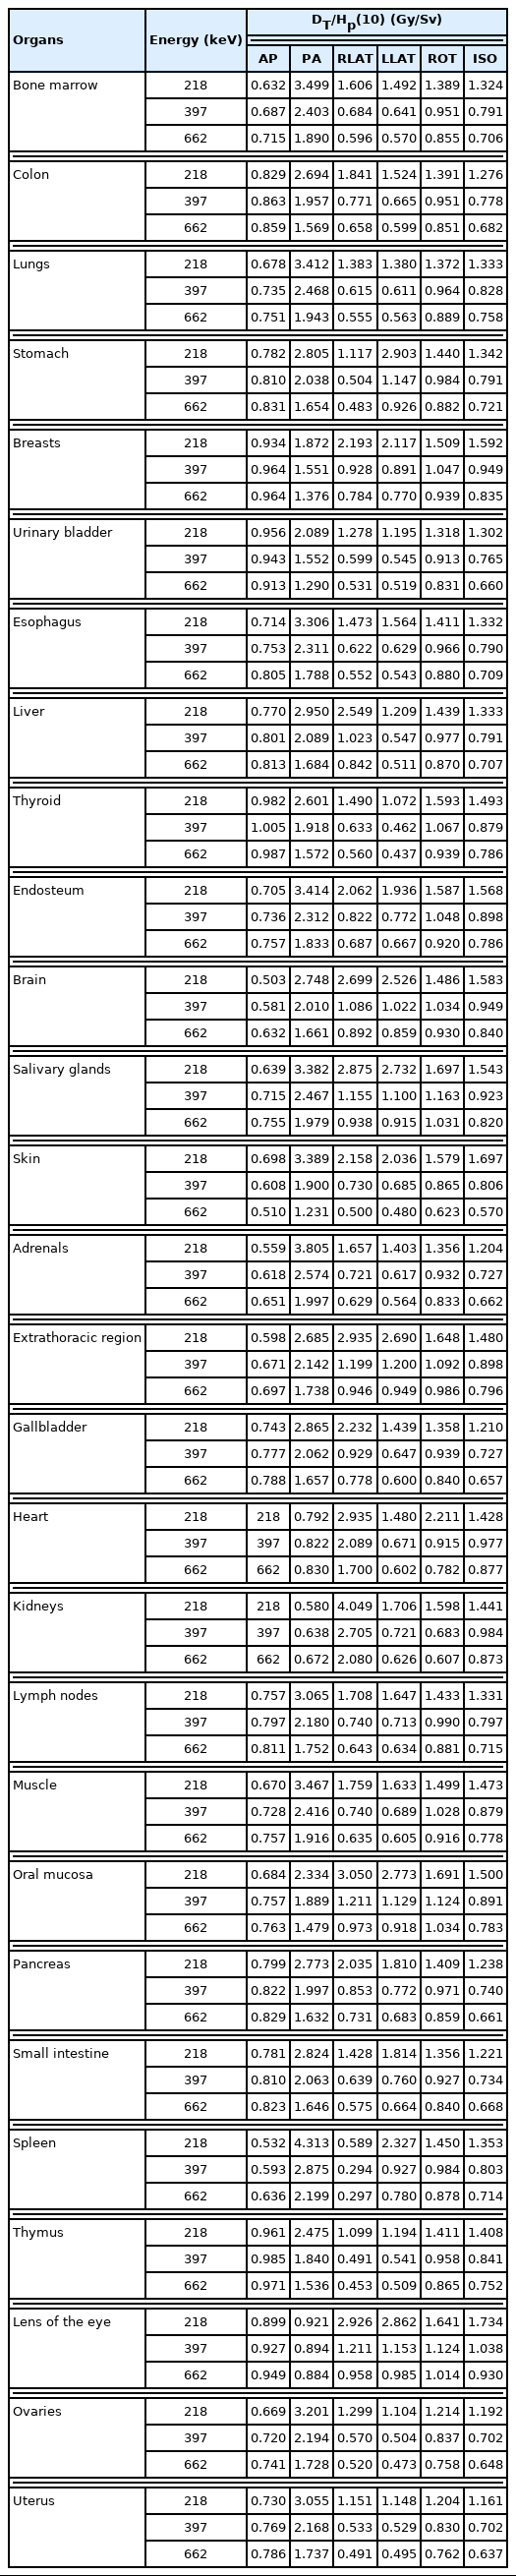
Bias-Corrected DT/Hp(10) Conversion Coefficients for Female