Impact of 0.35 T Magnetic Field on Dose Calculation for Non-small Cell Lung Cancer Stereotactic Radiotherapy Plans
Article information

Abstract
Background
We investigated the impact of 0.35 T magnetic field on dose calculation for non-small cell lung cancer (NSCLC) stereotactic ablative radiotherapy (SABR) in the ViewRay system (ViewRay Inc.), which features a simultaneous use of magnetic resonance imaging (MRI) to guide radiotherapy for an improved targeting of tumors.
Materials and Methods
Here, we present a comprehensive analysis of the effects induced by the 0.35 T magnetic field on various characteristics of SABR plans including the plan qualities and dose calculation for the planning target volume, organs at risk, and outer/inner shells. Therefore, two SABR plans were set up, one with a 0.35 T magnetic field applied during radiotherapy and another in the absence of the field. The dosimetric parameters were calculated in both cases, and the plan quality indices were evaluated using a Monte Carlo algorithm based on a treatment planning system.
Results and Discussion
Our findings showed no significant impact on dose calculation under the 0.35 T magnetic field for all analyzed parameters. Nonetheless, a significant enhancement in the dose was calculated on the skin surrounding the tumor when the 0.35 T magnetic field was applied during the radiotherapy. This was attributed to the electron return effect, which results from the deviation of the electrons ejected from tissues upon radiation due to Lorentz forces. These returned electrons re-enter the tissues, causing a local dose increase in the calculated dose.
Conclusion
The present study highlights the impact of the 0.35 T magnetic field used for MRI in the ViewRay system for NSCLC SABR treatment, especially on the skin surrounding the tumors.
Introduction
Non-small cell lung cancer (NSCLC) is a major cause of cancer-related mortality worldwide, with more than 1,000,000 related deaths occurring each year [1–3]. Although surgery is the most representative treatment for NSCLC cases with high mortality rates, it does not constitute a default option for a significant percentage of patients owing to various reasons. In fact, approximately 30% of early-stage NSCLC patients do not have surgery, with 65% of elderly patients older than 75 years [4]. Additionally, patients with comorbidities, which may increase surgical risk, generally do not undergo surgery [5–7]. Nonetheless, a decision not to undergo surgery can also be due to a patient’s perception of prognosis and racial factors. Thus, for patients excluding the surgery option, Stereotactic ablative radiotherapy (SABR) is the alternative route to conventional fractionated radiotherapy [8–10]. SABR is a radiotherapy method with extremely high ablation doses, usually provided in three to eight treatment fractions within 2 weeks, to minimize the toxicity risk induced to normal cells. Many studies have demonstrated that SABR treatment for NSCLC patients achieves better local control, survival rates, and less toxicity, compared to conventional radiotherapy [5, 11, 12]. Nonetheless, the SABR treatment requires a set of logistics including immobilization to prevent patient movements during radiation treatment, treatment plans, and actions to describe tumor movements during radiation delivery, dose distribution for tumors, and steep dose slopes from tumors to surrounding normal tissue [13, 14]. SABR is a method of high-precision radiation therapy with a relatively larger amount of irradiation per fraction than conventional fractionated radiotherapy, which imposes an essential need for highly accurate treatment. The ViewRay system (ViewRay Inc.) provides means to deal with most of the SABR treatment requirements. Magnetic resonance imaging (MRI) is performed in real-time, with a 0.35 T magnetic field, during radiation treatment [15–17]. This enables accurate doses to be delivered to the targeted tumor. However, the low magnetic strength used in ViewRay infers poor image quality. Most importantly, the magnetic field during treatment affects dose calculations, causing dose enhancement or reduction. Raaijmakers et al. [18] reported a reduced build-up distance induced by the magnetic field because it creates an electron trajectory between collisions in the form of curves. In addition, a dose enhancement usually arises due to the electron return effect (ERE) at tissue-air interfaces. Electrons leave the tissue at a certain rate and then deviate from the path by the magnetic field, curve in the air and enter the tissue again, causing a local dose enhancement. Raaijmakers et al. [19] found that ERE increased the dose enhancement by 40% at the beam exit region. This phenomenon affects the dose depositions in the clinical planning stage [19]. Esmaeeli et al. [20] reported the effects of a magnetic field (1.5 or 3.0 T) on dose distribution in breast-cancer plans. Besides, Kim et al. [21] reported the impact of a low magnetic field on dose calculation for partial breast irradiation. In particular, observations on the outside of the body confirmed maximum dose (Dmax) showed a 5.0±10.5 Gy dose difference. Moreover, Son et al. [22] evaluated the influence of the magnetic field in the prostate SABR plan. It was reported that Dmax differs by 1.28±1.08 Gy on the outside of the body, confirming that the magnetic field has an influence at the tissue-air interface, inducing alterations to the dose calculation. The tumors in patients with NSCLC are surrounded by more air, compared to the tumors in patients with partial breast or prostate cancer. Therefore, in this study, we evaluated the effect of a 0.35 T magnetic field used in ViewRay on dose deposition. Clinically relevant dosimetric parameters and plan qualities were analyzed by comparing the presence/absence of a 0.35 T magnetic field for NSCLC SABR plans.
Materials and Methods
1. Patient Selection
Twenty patients who have undergone SABR treatment for NSCLC between January 2014 and February 2022 were selected using ViewRay, retrospectively.
2. Treatment System (ViewRay)
The ViewRay system consists of a radiation therapy technique using three 60Co sources, accompanied by MRI with a 0.35 T magnetic field. The system was equipped with three depleted 60Co heads on a ring-shaped gantry. Each multi-leaf collimator (MLC) used in this system is composed of two leaf banks equipped with a total of 60 equally mounted double-focus leaves (30 on each leaf bank). The leaf width of the MLC was 1.05 cm at the plane of the isocenter at a source to axis distance of 105 cm. Each leaf had a 0.3 mm thickness of tongue and groove on the leading edge and a 0.5 mm thickness on the adjacent sides. The interval gap of MLCs is 0.5 cm with a maximum aperture size of 27.3 cm×27.3 cm at the isocenter.
3. SABR Plans for Lung Cancer
The treatment plans without main magnetic field (B0)=0 T treatment plans that are being compared with the B0=0.35 T plans were not created from scratch. Instead, the B0=0 T plans were recalculated (but not re-optimized) with B0= 0.35 T plans to determine the extent to which the 0.35 T magnetic field affects dose depositions. The volume of planning target volumes (PTV) has a range of 3.0 to 41.0 cm3, with an average volume of 15.6 cm3. The isocenter was laterally fixed in order to prevent collision between the bore of the 60Co system and the patient’s arms. The dose was calculated with an radiofrequency coil using a 3 mm calculation grid size. The dose calculation of the 60Co system is achieved based on the Monte Carlo (MC) calculation algorithm developed by the manufacturer (ViewRay Inc.). The dose volume histogram (DVH) was analyzed for dosimetric parameters obtained from the ViewRay system.
4. Statistics Analysis
We used the IBM SPSS version 23.0 statistical software (IBM Co.) for the analysis. We used the paired t-test to evaluate the difference in dose deposition with and without a 0.35 T magnetic field. The paired t-test compares the means of two results taken from the related targets. The results are presented as the average±standard deviation. Paired t-tests and paired-sample comparisons were calculated.
5. Plan Evaluation
We used the DVHs to assess the impact of the 0.35 T magnetic field. The corresponding results were analyzed for the presence/absence of a low magnetic field, respectively. For the PTV, we compared the results of dose for mean dose (Dmean), minimum dose (Dmin), Dmax, the dose delivered to the 5%, 90%, 95%, and 100% of the volume (D5%, D90%, D95%, and D100%, respectively). For organs at risks (OARs), the dosimetric parameters were compared with Dmax for the spinal cord; Dmax for the heart; Dmax for bronchi; Dmax and the volume receiving doses equal to or greater than 40 Gy (V40Gy) for ribs; Dmax for skin; Dmean, the volume receiving doses equal to or greater than 10 Gy (V10Gy), the volume receiving doses equal to or greater than 5 Gy (V5Gy), and the dose delivered to the volume 1,000 cm3 (D1000cm3) for the contralateral lung; and Dmean, the volume delivered to the 20 Gy (V20Gy), V10Gy, V5Gy, and D1000cc for the ipsilateral lung. We also analyzed Dmean, Dmin, and Dmax for the inner and outer shells (±3 mm from body surface) in order to evaluate the impact of the magnetic field in the patient surface region. Furthermore, the change in the plan’s quality was quantitatively evaluated based on the change in dosimetric parameters. The homogeneity index (HI), conformity index (CI), and target coverage were analyzed to evaluate the plan’s qualities. The HI, which quantifies the dose homogeneity in the PTV, was calculated as the ratio of D5% to D95% [23]. The CI, which indicates the relationship between isodose distribution and PTV, was calculated as the ratio of the prescription dose delivered volume to the PTV volumes [24]. All plans have a target coverage of 95% for the target volume, receiving 100% of the prescription dose.
Results and Discussion
Fig. 1 shows the comparison results of the dose deposition in the presence/absence of a 0.35 T magnetic field.
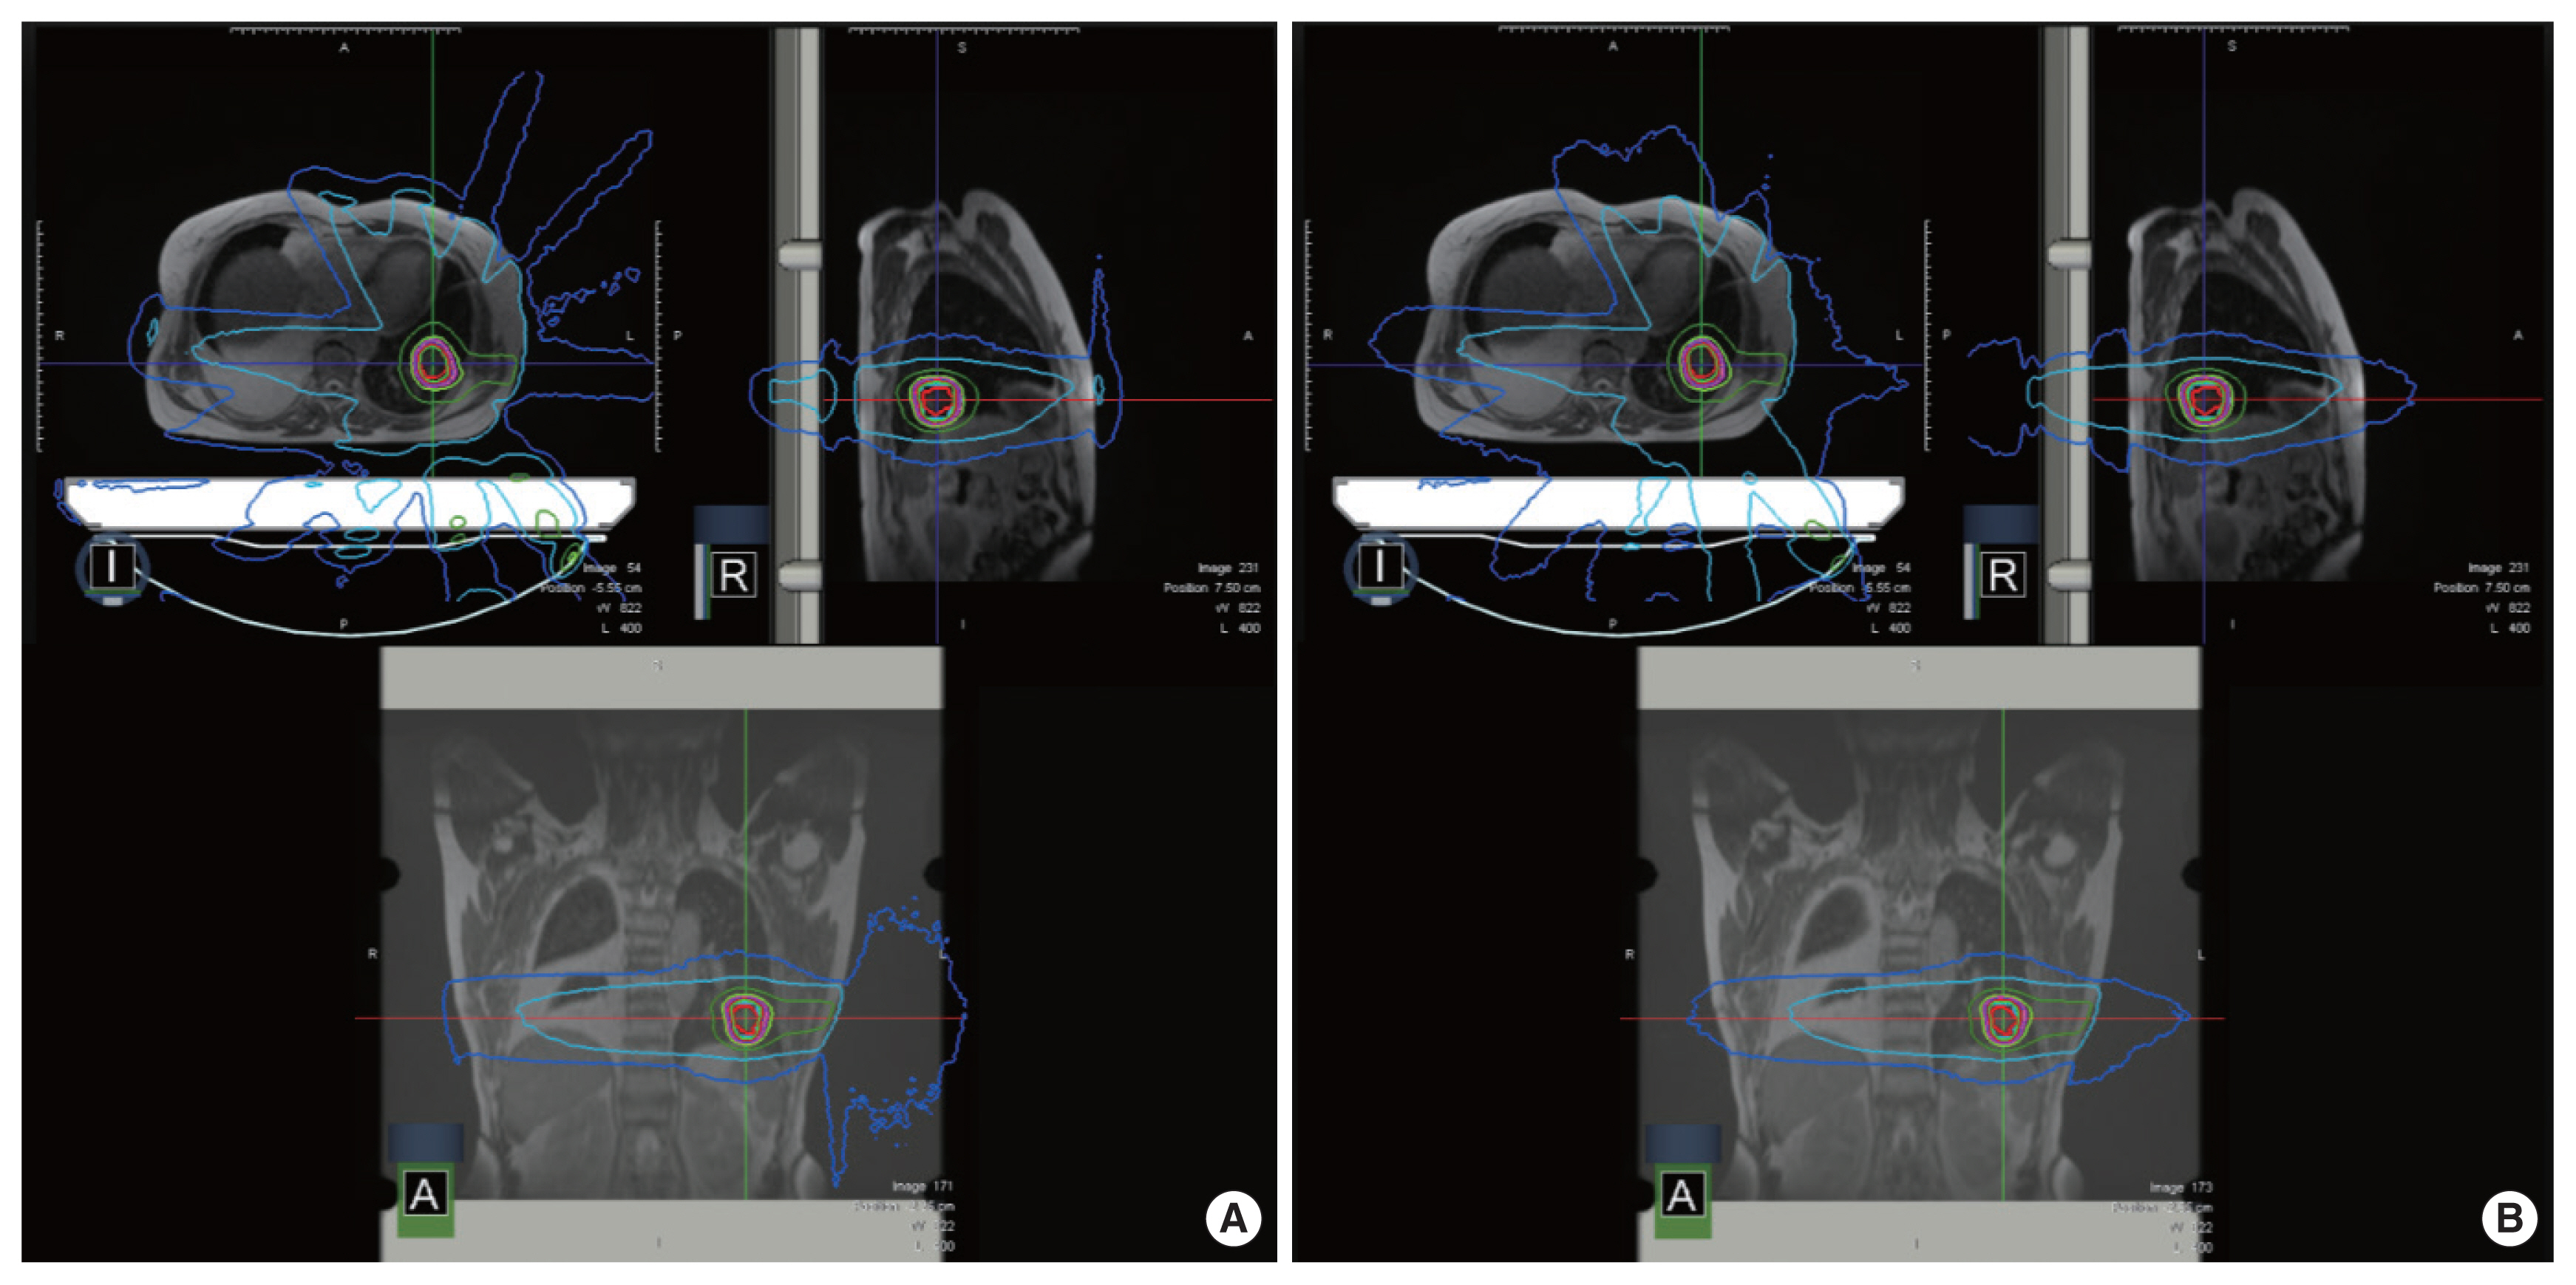
An example of dose calculation for non-small cell lung cancer stereotactic radiotherapy plan: (A) with a magnetic field (B0=0.35 T), (B) without a magnetic field.
1. PTV Dose Distribution Difference
The calculated dose deposition for PTV was obtained with/ without a 0.35 T magnetic field. The analyzed doses were Dmean, Dmin, Dmax, D5%, D90%, D95%, and D100%, as listed in Table 1. The average differences in dose depositions between the cases with/without the magnetic field were determined at Dmean, Dmin, and Dmax as 0.21±0.18 Gy (p=0.36), 0.48±0.34 Gy (p= 0.38), and 0.58±0.43 Gy (p=0.38), respectively. At D5%, D90%, D95%, and D100%, the average differences in dose deposition were calculated to be 0.31±0.30 Gy (p=0.35), 0.27±0.28 Gy (p=0.38), 0.28±0.29 Gy (p=0.39), and 0.48±0.34 Gy (p=0.38), respectively.

Planning Target Volume Dosimetric Parameters with/without Magnetic Field
These results show very small differences between the dose calculations (but only one optimization) in the presence and absence of a 0.35 T magnetic field. This clearly indicates that the 0.35 T magnetic field, used for MRI in the ViewRay system, has no significant effect on the dose depositions for the PTV.
2. Plan Qualities Difference
Table 2 summarizes the plan qualities of the NSCLC SABR plans in the presence/absence of a low magnetic field. The results were analyzed for HI, CI, and target coverage. In the presence of a 0.35 T magnetic field, the following results were obtained for these parameters: HI=1.01±0.05; CI=1.25± 0.016; and target coverage=0.95±0.02. When the calculation was performed without the magnetic field, the following results were obtained: HI=1.10±0.05; CI=1.28±0.17; and target coverage=0.94±0.05. For target coverage, the p-value was determined at 0.18 for the presence/absence of a magnetic field. Therefore, the comparison of these indicators clearly indicates that the plan quality is not affected by the presence and absence of the 0.35 T magnetic field.

Plan Quality Indices with/without Magnetic Field
3. Organs at Risk Dose Distribution Difference
Table 3 presents the average difference for the OARs including the spinal cord, heart, bronchi, ribs, skin, contralateral lung, and ipsilateral lung. The average differences in Dmax for the spinal cord, heart, and bronchi, were determined as 0.13±0.12 Gy (p=0.50), 0.21±0.17 Gy (p=0.50), and 0.05± 0.08 Gy (p=0.50), respectively. For the ribs, the differences in Dmax and V40Gy were 0.20±0.28 Gy (p=0.40) and 0.15±0.45% (p=0.45), respectively. For the opposite lung where the PTV was located, Dmean and D1000cc yielded average differences of 0.04±0.13 Gy (p=0.45) and 0.01±0.01 Gy (p=0.42), respectively. For V10Gy and V5Gy, the average differences were 0.01± 0.02% (p=0.42) and 0.06±0.07% (p=0.45), respectively. For the ipsilateral lung, the average differences for Dmean, D1000cc, V20Gy, V10Gy, and V5Gy were 0.72±2.30 Gy (p=0.38), 0.02±0.02 Gy (p=0.46), 0.17±0.29% (p=0.49), 0.13±0.15% (p=0.50), and 0.22±0.46% (p=0.49), respectively. The very small differences obtained between the values in the presence and absence of the low magnetic field indicate that these conditions do not affect the dosimetric parameters for various OARs.

Organs at Risk Dosimetric Parameters with/without Magnetic Field
4. Dose Distribution Difference around the Skin
The dose difference around the skin in the presence/absence of a low magnetic field is shown in Table 4. For the inner shell, the dose differences in terms of Dmean, Dmin, and Dmax were 0.03±0.02 Gy (p=0.47), 0.04±0.13 Gy (p=0.15), and 0.47±0.33 Gy (p=0.41), respectively. No statistically significant differences were observed for the inner shell. However, for the outer shell, the differences in terms of Dmean, Dmin, and Dmax were 0.08±0.06 Gy (p=0.45), 0.02±0.04 Gy (p=0.15), and 3.58±2.60 Gy (p=0.05), respectively. This result means that the Dmax of the outer shell is significantly affected by the presence of the 0.35 T magnetic field.

Inner/Outer Shell Dosimetric Parameters with/without Magnetic Field
The impact on the dose deposition of the 0.35 T magnetic field, applied in ViewRay to guide radiation therapy, was analyzed for SABR plans for NSCLC in terms of the variation in dose distributions for PTV, OARs, and outer/inner shells. The effect on plan quality indices (i.e., HI, CI, and target coverage) was also analyzed. For this, two NSCLC SABR plans were designed: one original plan with a 0.35 T magnetic field and another in the absence of the magnetic field. Although no significant differences were observed in PTV, plan qualities, and OARs, results showed a significant increase in doses outside the body. This indicates that the ERE induces variations in the dose deposition around the skin in SABR plans for NSCLC.
The MC algorithm based on a treatment planning system (TPS) was employed to evaluate the treatment plans. To use high performance for the optimized simulation of photons, the TPS system applied a variance reduction technique. Dose calculation based on the MC algorithm in the presence/absence of a magnetic field provides geometric information of secondary electrons generated by photons [25]. These electrons can be bent by Lorentz forces and thus have arc-shaped trajectories in water or tissue, causing physical changes such as reduced accumulation, increased doses, and penumbra [26]. In this case, the deviation in dose distribution might have increased in the body. However, Esmaeeli et al. [20] have shown that a dose distribution with an increase or decrease of 7% or 12%, respectively, might occur near the surface. They argued that the increase or decrease in dose to the PTV, internal and contralateral tissues could be reduced because of the magnetic field. In contrast, we have confirmed in our previous studies that low magnetic fields increase the dose, especially near the body surfaces [21, 25]. In the present study, our findings demonstrate that, in the PTV and internal tissues, the dose distribution with magnetic fields did not change compared to the case where condition without the magnetic field was applied for breast and liver cancers [21, 25]. Nonetheless, we report on a slight increase in dose due to the ERE outside the body. In addition, electrons may be more likely to build-up again, especially in air.
These results indicate that further studies are needed on the impact of low magnetic fields for different treatment techniques and sites. In addition, Unity (Elekta) has been developed to allow 6 MV planarization filter free beams to be irradiated to targets, while simultaneously obtaining images using 1.5 T magnetic fields [27]. In the case of a 1.5 T magnetic field, the differences in dose deposition for the PTV, OARs, and skin are greater than those caused by the impact on the 0.35 T magnetic field [28].
Conclusion
This study shows that a 0.35 T magnetic field has an impact on the dose depositions in NSCLC SABR plans. In particular, there was a significant increase in the outer shell dose under the 0.35 T magnetic field due to scatter radiation or the secondary electrons. No significant differences of dose depositions were identified in the PTV, plan quality, and OARs.
Notes
Conflict of Interest
No potential conflict of interest relevant to this article was reported.
Ethical Statement
This study was approved by the Institutional Review Board of Seoul National University Hospital (approval number: H-2008-200-1155). Written informed consent by the patients was waived due to a retrospective nature of our study.
Author Contribution
Conceptualization: Kim J. Methodology: Choi CH, Park JM. Formal analysis: Lee SY. Funding acquisition: Kim J. Project administration: Kim J. Visualization: Son J. Writing - original draft: Son J. Writing - review & editing: Son J. Approval of final manuscript: all authors.
Acknowledgements
This research was supported by the National Research Foundation of Korea (NRF) grant funded by the Korean government (Ministry of Science and ICT) (Grant No. 2021M2E 8A1049195) and (Grant No. 2019K1A3A1A80113183).