

Introduction
Research regarding radiation measurement and luminescence began with the measurement of radiation using thermoluminescence (TL) and studies of the physical characteristics of materials used in radiation detectors. However, with the development of new measuring equipment and measurement methods, research using optically stimulated luminescence (OSL) is in progress. Currently, the known OSL measurement methods can be categorized into 3 groups. The first is continuous-wave OSL, in which the sample is stimulated using a constant-strength light source. This is the most common method and is typically used in measuring radiation. The second method is linear modulated OSL, in which the strength of the light source is increased linearly to measure the stimulated luminescence. This method is typically used to calculate the photoionization cross-sections of lattice defects. The last method is time-resolved OSL (TR-OSL), in which the sample is stimulated with multiple short pulses of light over a set period of time.
The TR-OSL method distributes the luminescence over time, and has the following benefits. First, it has a very high level signal-to-background ratio for luminescence over the measurement time because the background measured after the pulse is only the electronic background from the photomultiplier tube (PMT). Second, because the width of the optical stimulating pulse is very small, the activated electrical charge due to the optical stimulation is miniscule. Hence, the luminescence can be monitored for extended periods of time. This is because the system maintains a quasi-equilibrium during the pulses, causing the electron concentration to be nearly constant [1]. Third, TR-OSL can provide information regarding the lifetime of the sample, making it a useful tool for researching the mechanism behind the luminescence process.
TR-OSL measurement systems that utilize quartz samples can be categorized into 3 groups based on the method used to emit the optically stimulating light source as a pulse. In the first group, an electronic shutter is attached on a continuous laser to periodically emit an optically stimulated pulse, and the luminescence is measured using a filter set with a small band width in front of the PMT [2, 3]. This method can only produce pulses with periods of 10–100 ms or longer and can only measure samples with a lifetime of approximately 35–5000 ms. The second method is to use a pulse laser. Clark et al. [4] and Clark and Bailiff [5] built a TR-OSL measurement system using a pulse laser with a wavelength of 800 nm, a filter to remove the scattered light from the luminescence instrument and pulse laser, and a PMT. This measurement system has a switching speed of less than 5 ns, allowing it to measure samples that have a lifetime of less than 5 ns. The last method involves emitting a current pulse to an optically stimulating light source made from a light-emitting diode (LED) cluster to use it as an optically stimulated pulse. Galloway et al. [6, 7] built an optically stimulating light source by connecting 16 green LEDs (Nichia NSPG-500) in parallel and combining it with a pulse LED drive circuit made from a multivibrator 2N74221 integrated circuit chip and resistor-capacitor timing device to create a TR-OSL measurement system. This measurement system contains a 3- to 30-μs constant current pulse circuit for quartz and a 25-ns constant current pulse circuit for feldspar. In addition, the Time to Pulse Height Converter (TPHC, ORTEC 467) and the Constant Fraction Discriminator (CFD, ORTEC 473A) modules were used to measure TR-OSL. Eventually, Galloway used a multichannel scaler (MCS, ORTEC MCS plus) instead of the TPHC and CFD modules to increase TR-OSL measurement efficiency and ease of use [8].
In this research, a TR-OSL measurement system was developed using a directly cooled blue power LED as an optically stimulating light source, an 80-MHz maximum constant current pulse circuit with a modifiable pulse duty ratio as the optically stimulated pulse, and a PMT combined with a MCS to measure the TR-OSL signal. In addition, quartz sample, which is widely used as radiation dosimeter, was used to test the performance of the developed device and then compared with the existing research results.
Materials and Methods
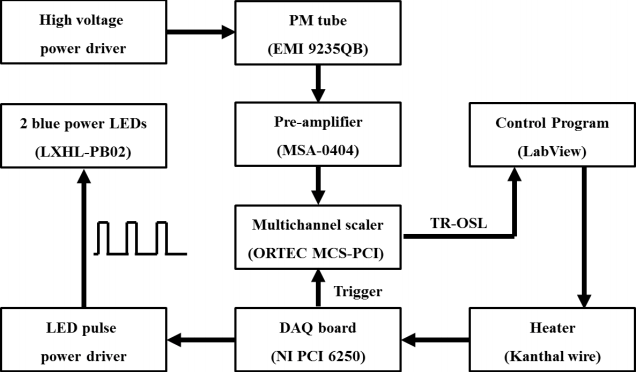
The developed TR-OSL measurement system can be divided into the heater, the optically stimulating light source, and the luminescence detection portions. These portions must be all independently and collectively controllable. Figure 1 shows the schematic for the TR-OSL measurement system, with the control program using LabView (National Instruments, Austin, TX).
1. Heater Portion
Heating the sample at a specific temperature for a set period of time is a critical process in the measurement of luminescence. The heating treatment can be divided into preheating, which is done prior to the luminescence measurement, and processing done during the luminescence measurement. Preheating is done to remove luminescence that may occur due to electrons captured in the unstable shallow trap (such as the 110°C TL peak from irradiated quartz with ionizing radiation), to replicate the natural thermal transfer that may occur during storage periods, to adjust for the changes in luminescence sensitivity, and to prevent radiation quenching [9]. The heating treatment done during the measuring of quartz luminescence is to prevent the reduction in luminescence due to some electrons emitted during the stable 325°C peak being recaptured by the unstable 110°C TL peak.
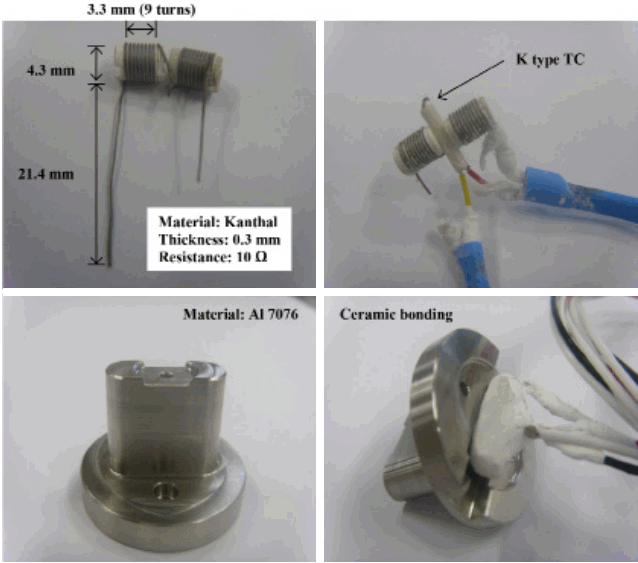
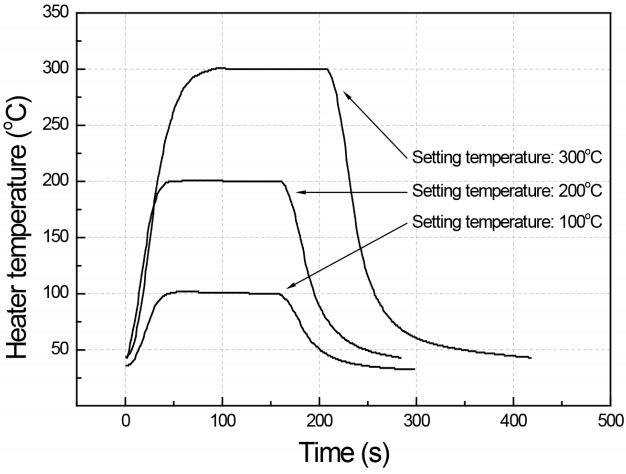
The heater itself, which plays a critical role in TR-OSL measurements, was constructed as part of this study. The heater must be capable of reaching a maximum temperature of 500°C and have a temperature increase rate of approximately 5°C·s−1 in order for it to be suitable for measuring radiation from luminescence. In addition, it must also be capable of maintaining a constant temperature for more than 100 seconds. The heating element was built by wrapping 18 loops of Kanthal wire (thickness, 0.3 mm; resistance, 10 Ω) around a ceramic cylinder with a diameter of 4.3 mm. A K-type thermocouple was placed at the center of the heating element to measure the temperature. Figure 2 shows the manufacturing process and final form of the heater developed in the research. To heat the sample, 10 volts of direct current (VDC) and 2 A of power was provided to the Kanthal wire, taking into consideration the heat capacity of the wire. A solid-state relay (SSR) was used to control the power, while the changes in temperature were made using a temperature controller (SM-940, Samwon Eng, Gimhae, Korea) that was capable of SSR output and proportional-integral-derivative control. The heating treatment of the sample in measuring TR-OSL is typically done at a temperature between 100°C and 300°C. Hence, the performance and stability of the heater was evaluated by maintaining temperatures of 100°C, 200°C, and 300°C for 100 seconds. As can be seen in Figure 3, although the temperature of the heater did not increase linearly, the heater could maintain each set temperature for 100 seconds. In addition, the heater cooled at an exponential rate, making it suitable for TR-OSL measurements.
2. Optically Stimulating Light Source
The TR-OSL measurement system developed in this research used two powerful blue LEDs (LXHL-PB02, Lumileds Lighting, San Jose, CA; side emission, 23.5–43 mW·cm−2; temperature increment (ΔλD/ΔTJ), 0.04 nm·°C−1; viewing angle (2θ1/2), 150°) with a power density of 23.5–48 mW·cm−2 instead of previous blue LEDs as the optically stimulating light source. The powerful blue LED emits light at a wavelength of 470±25 mm and has a relatively high heat output, which causes changes in power density. Hence, cooling is of utmost importance. When LED sources are used as an optically stimulating light source, there are 2 main methods of preventing power density changes of the LED due to the increase in heating value. The first is to directly cool the LED by attaching a heat sink or a cooling module. In such cases, the optically stimulating light source portion must be separated from the body and a measuring device must be created separately. The second method is to use a servo feedback circuit to electrically compensate for the reduced current due to internal heat produced by the LED [10]. In this research, a heat sink was directly attached to the LED to reduce the heating value.
A VIS liquid light guide (VIS-LLG, 77631, Newport Corporation, Irvine, CA) optimized for the visible light range was used to stimulate the sample using the light produced by the light source. The VIS-LLG has a diameter of 8 mm, a total length of 1 m, a minimum bend radius of 100 mm, and a light transmission range of 340–800 nm. A 3-mm-thick Scott GG-420 long-pass filter was attached to the front of the VIS-LLG to remove ultraviolet rays produced by the light source. Although the VIS-LLG with the GG-420 filter attached can stimulate the sample with just blue light by effectively removing short-wavelength light produced by the source, doing so significantly reduces the light produced by the LED during the process.
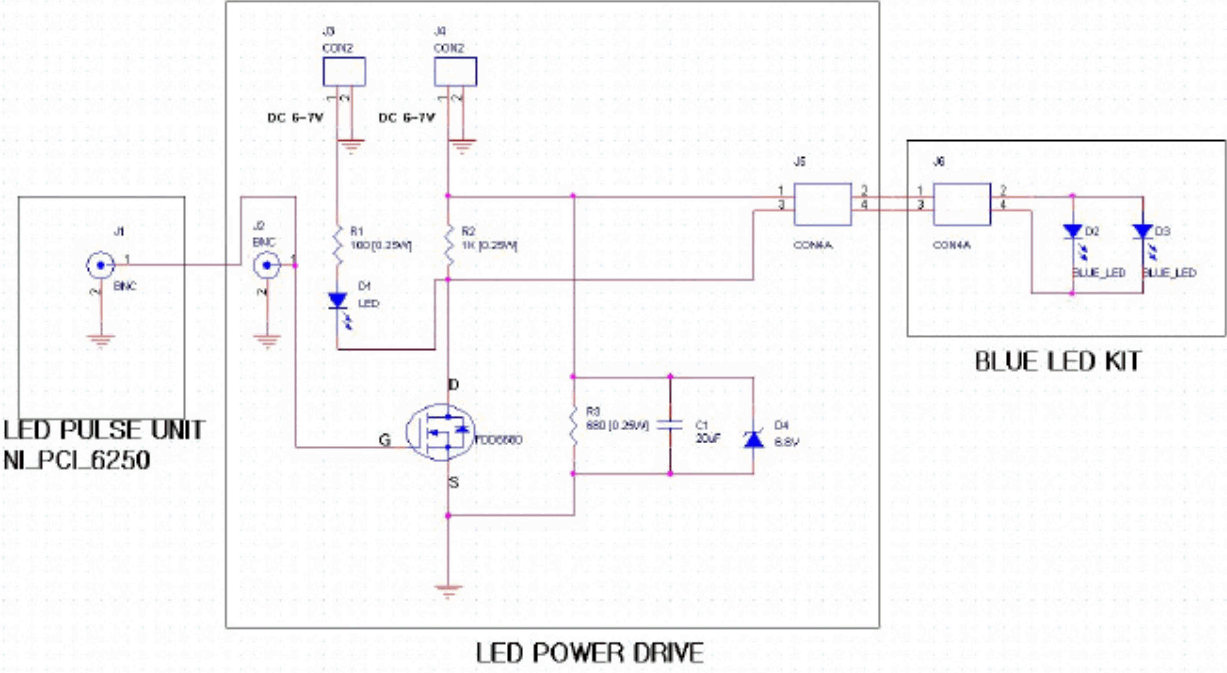
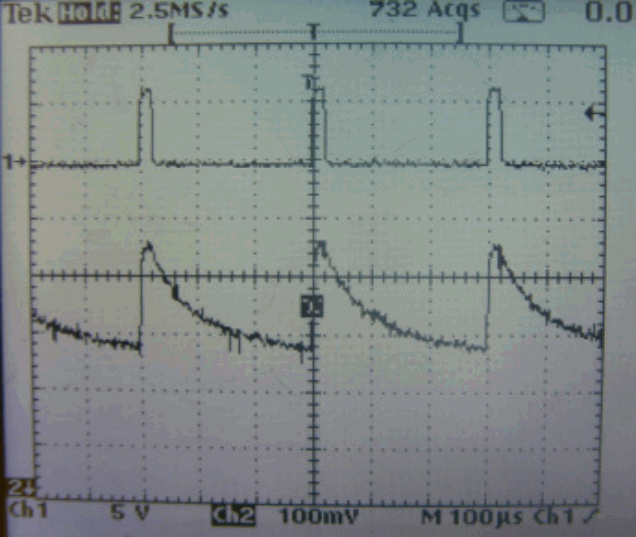
The optically stimulating light source was controlled by instantaneously providing 6.5 VDC, 4 A power to the LED (as shown in Figure 4), with N-Channel MOSFET FDD6680 (30 VDC, 46 A) as the on/off switch for the power supply. The counter/timer port on the data acquisition (DAQ) board (NI PCI 6250, National Instruments, Austin, TX) generated the pulse signal, with a maximum frequency of 80 MHz and a freely adjustable duty ratio. The pulse used in this research had a basic pulse with a width of 10 μs and a period of 250 μs. Figure 5 shows a comparison of the pulse signals generated by the DAQ board (pulse width, 10 μs; pulse period, 250 μs) and the response from the LED. The response from the LED was measured using a photo sensor and no time delay occurred between the pulse and the LED response in the rising edge section, as seen from the picture. This meant that the generated pulse could be directly used as the external trigger for the MCS (MCS-PCI, Ortec, Oak Ridge, TN) without a time delay device such as a delay cable for the pulse signal portion. In addition, the exponential decrease in the falling edge portion of the reactive behavior was probably due to the capacitor within the photo sensor.
3. Luminescence Detection Portion
TR-OSL measurement typically takes places by combining a PMT with a filter that allows waves of specific wavelengths to pass through. The PMT, in particular, must be one that is sensitive to the wavelength range that is emitted by the sample. A bialkali EMI 9235QB PMT (ET Enterprises, London, United Kingdom) was used in this study, along with PMT housing (PR1406CE0004, Products of Research, Danvers, MA) optimized for the EMI 9235 series. The detection portion, such as the PMT, was placed above the light source in the TR-OSL measurement system. Because the wavelength ranges of the light from the optically stimulating light source and the luminescence from the sample overlap, a liquid light guide with the GG-420 filter attached was first used to remove the ultraviolet rays from the light source, then a 7.5-cm-thick Hoya U-340 filter with a transmission range of 255–405 nm was placed between the detection portion and light source. Figure 6 shows the filter combination used in this study.
The photons that reach the PMT react with the photocathode to emit electrons. A high voltage of 1,000 VDC is required for these electrons to be amplified between the dynode and the anode. A device to provide this high voltage to the PMT was developed in this study. Figure 7 shows the circuit for the high voltage supply device, which consists of an EMI noise filter and a bridge circuit consisting of 4 diodes (2,000 VDC, 1 A). The voltage output can be selected from a range of 500–1,500 VDC, and was set to 1,200 VDC for this research. In addition, a pre-amplifier with a silicon bipolar monolithic microwave integrated circuit amplifier (MSA-0404) was also built in order to reduce the signal loss and electrical noise from the PMT and to increase the accuracy of the measurement. Figure 8 presents the circuit for the preamplifier. The amplified signal from the preamplifier was measured using the MCS.
TR-OSL repeatedly takes measurements of up to hundreds of thousands of pulse signals based on the on/off settings of the LED and cumulates the measurements to extract the final result. Hence, it must have a very short dwelling time and no dead time between channels and pulses to obtain accurate measurements. Therefore, a MCS was used, as well as a MCS-OCI-OPT2 cable for the input and output of the signals. The ORTEC MCS-PCI card has a measurement period from 100 ns to 1,300 s, with a selectable channel range of 4–65,536 per period. In addition, it does not have a dead time between channels and pulses, making it very suitable for TR-OSL measurements. There also is a discriminator within the ORTEC MCS-PCI card that can effectively remove the electrical noise amplified by the preamplifier.
The pulse generated from the counter/timer port on the DAQ board was used as an external trigger for the TR-OSL measurement. This pulse, as shown in Figure 4, is synchronized with the LED from the light source, allowing it to begin TR-OSL measurement at the same moment the LED is lit on the rising edge of the pulse. The measurements take place during the selected pulse sweep and the TR-OSL signals are compiled in each channel to produce the final TR-OSL signal from the sample.
Results and Discussion
1. TR-OSL Measurements
In order to verify the reliability of the TR-OSL measurement system that was constructed, the TR-OSL signal from a 90–250 μm BDH quartz sample was measured. Prior to the measurement, the quartz was heat-treated in a muffle furnace at 600°C for 1 hour to increase its sensitivity to radiation. It was then chemically treated with concentrated HF (48%) for 10 minutes to remove impurities.
The TR-OSL measurement process consisted of 100-Gy X-ray irradiation, 60 seconds of heat treatment at 220°C, and luminescence measurement. The optically stimulating pulse had a width of 60 μs and a period of 250 μs, and was repeated 100,000 times. The TR-OSL signal measurement period was fixed at 1 μs·ch−1 per pulse. In addition, in order to prevent interference from the 110°C TL peak, the TR-OSL measurement was started after the sample reached a temperature of 120°C.
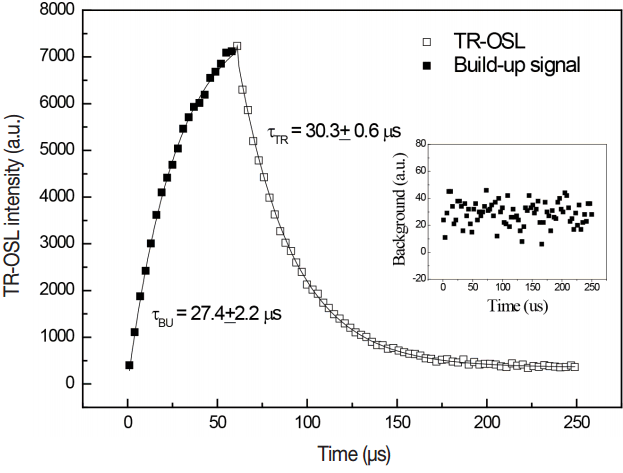
Figure 9 shows the TR-OSL and background signals measured from the BDH quartz. The black squares (■) in the figure are the build-up signals measured during the 60-μs period when the LED was on, and the clear squares (□) are the TR-OSL signals emitted when the LED was off. The TR-OSL measurement results from the heat-treated BDH quartz sample were very close to the measurements reported by Chithambo [11] using the same sample. In addition, there were no changes in the background signal before and after the LED was turned on and off and the background signal strength was less than 60 counts/μs. Hence, the TR-OSL measurement device developed in this research can be considered to be very reliable.
2. Calculating the Luminescence Lifetime of Quartz
The lifetime of the sample can be calculated from the TR-OSL signal by applying a theoretically calculated function as a curve fit to the measured signal. The rate of change in concentration of electrons captured by the lattice defect according to the energy band theory can be expressed as Equation 1.
In the equation above, s is the probability of optical stimulation per unit time, A is the initial concentration of electrons captured, and α is the decay constant. The change in electron concentration per optical stimulation time calculated from the equation above is shown in Equation 2.
If the sample is optically stimulated by the pulse during the tON period, the build-up signal (LON) and the TR-OSL signal (LOFF) can be calculated from Equations 3 and 4.
The Equations 3 and 4 were both curve-fitted to calculate the lifetime of the BDH quartz from the TR-OSL signal shown in Figure 9. SigmaPlot software (Systat Software, San Jose, CA) with the non-linear least square method, which uses the Lenenberg-Marquardt algorithm, was used to calculate the results [12]. The lifetime of the build-up signal accumulated during the optically stimulating pulse was calculated to be 27.4±2.2 μs, while the lifetime of the TR-OSL signal measured after the optically stimulating pulse was 30.3±0.6 μs. The lifetimes of the build-up signal and the TR-OSL signal measured using the developed measurement system are shown in Table 1. The results are within the error range of the measurement values from Chithambo [11].
Conclusion
This study developed and tested a TR-OSL measurement system for quartz sample, which is widely used in radiation dosimeter that uses OSL. The measurement system consisted of a heater portion to heat the sample, a stimulating light source portion with a powerful blue LED to stimulate the sample, and a detection portion with a PMT to measure TR-OSL signals. The distribution of measured TR-OSL signals and background signals were very close to previously presented research results. In addition, the calculated lifetimes of the build-up signals and TR-OSL signals using curve-fitting were 27.4±2.2 μs and 30.3±0.6 μs, respectively. These results are within the error range of the results of previous studies. Hence, the developed TR-OSL measurement system can be considered to be very reliable for measuring TR-OSL and calculating luminescence lifetimes.