Statistical Analysis of Count Rate Data for On-line Seawater Radioactivity Monitoring
Article information
Abstract
Background:
It is very difficult to distinguish between a radioactive contamination source and background radiation from natural radionuclides in the marine environment by means of on-line monitoring system. The objective of this study was to investigate a statistical process for triggering abnormal level of count rate data measured from our on-line seawater radioactivity monitoring.
Materials and Methods:
Count rate data sets in time series were collected from 9 monitoring posts. All of the count rate data were measured every 15 minutes from the region of interest (ROI) for 137Cs (Eγ = 661.6 keV) on the gamma-ray energy spectrum. The Shewhart (3σ), CUSUM, and Bayesian S-R control chart methods were evaluated and the comparative analysis of determination methods for count rate data was carried out in terms of the false positive incidence rate. All statistical algorithms were developed using R Programming by the authors.
Results and Discussion:
The 3σ, CUSUM, and S-R analyses resulted in the average false positive incidence rate of 0.164 ±0.047%, 0.064 ±0.0367%, and 0.030 ±0.018%, respectively. The S-R method has a lower value than that of the 3σ and CUSUM method, because the Bayesian S-R method use the information to evaluate a posterior distribution, even though the CUSUM control chart accumulate information from recent data points. As the result of comparison between net count rate and gross count rate measured in time series all the year at a monitoring post using the 3σ control charts, the two methods resulted in the false positive incidence rate of 0.142% and 0.219%, respectively.
Conclusion:
Bayesian S-R and CUSUM control charts are better suited for on-line seawater radioactivity monitoring with an count rate data in time series than 3σ control chart. However, it requires a continuous increasing trend to differentiate between a false positive and actual radioactive contamination. For the determination of count rate, the net count method is better than the gross count method because of relatively a small variation in the data points.
INTRODUCTION
After the accident in the Fukushima Daiichi nuclear power plants (NPPs) on March 2011 in Japan, many countries have worried about marine contamination of their own territories due to artificial radionuclides released from decontaminating and/or demolishing the Fukushima nuclear facilities. The accident became a motivation for strengthening the infrastructure for the national radiological monitoring system in the marine environment in Korea. The Korea Institute of Nuclear Safety (KINS) is responsible for the routine and/or emergency monitoring of seawater radioactivity along the coast surrounding the Korean peninsula. Since 2018, the on-line monitoring system for seawater radioactivity has been operated at the 18 monitoring posts in tidal observation facilities, buoys, seawall, and in the bottom of a liner.
Conventional methods to detect radionuclides in seawater involve collecting seawater samples, transporting to a laboratory, concentrating a radionuclide of interest, and finally applying detection methods to quantify the radioactivity. This process is a tedious work to obtain a result and may significantly delay detection of an abnormal events. Thus, an on-line radiation monitoring system is necessary that can detect radionuclides to recognize these abnormal events in real-time [1]. Real-time water monitoring networks have been established in some countries including Japan, Germany, Switzerland, Jordan, and Thailand. The goal of on-line radiological monitoring is to quickly detect small or abrupt changes in activity levels in the presence of significant ambient background. Especially, it is very difficult to distinguish between a radioactive contamination source and background radiation from natural radionuclides in the marine environment by means of on-line monitoring system.
The detection decision whether a radioactive source exists or not is made based on a specific statistical process. Even though there are different methods for making a detection decision, the methods most often used in radioactivity measurement involve the principles of statistical hypothesis testing. Ideally, we want to make a decision with no false positives (Type I error) or false negatives (Type II error), however this is unrealistic. Radioactive decay is a random process. Consequently, any measurement based on detecting radiation emitted in nuclear decay is subject to some degree of statistical fluctuation. The Poisson distribution or Gaussian distribution commonly characterizes the random nature of radioactive decay. Therefore, we cannot avoid random error in any final decision [2, 3].
In practice, a proper statistical method or technique is chosen to minimize both the false positive detection rate (α) and false negative detection rate (β). A typical statistical method used in radiation monitoring is the Shewhart (3σ) control chart [4]. A conventional radiation monitoring method based on classical statistics involves setting a decision level for a given false positive rate. Then a count or count rate is compared to the decision level. If the value of the result is greater than the decision level, then one makes the decision that there is activity present above the background. The 3σ control chart can be conducted easily, but it is relatively insensitive to small changes in radiation levels. Therefore, the form of the cumulative sum (CUSUM) control chart developed and adopted to detect small changes [5]. The CUSUM is based on the summation of the deviation of the normalized parameter from a reference level over the number of data points. The classical control chart can be easily conducted, however, it has a disadvantage that only information contained in the latest data point is used. Furthermore, the information contained by the entire sequence of data points is disregarded.
Unlike classical statistics, Bayesian statistics permits the formal incorporation of prior subjective knowledge, belief and information beyond that contained in the observed data in the inference process via Bayes’ theorem. Bayesian techniques have been applied for reducing false positive rates in low level radioactivity monitoring [6]. A Bayesian control chart method, Shiryaev-Roberts (S-R) procedure, have been recently used to alert for a small change in radiation levels of an on-line radiation monitoring system because of incorporating a prior information and knowledge in the calculation [7, 8].
The objective of this study was to investigate a statistical process for triggering abnormal level of count rate data measured from our on-line seawater radioactivity monitoring. Thus the 3σ, CUSUM, and Bayesian S-R control chart methods were evaluated. Advantages and disadvantages of the CUSUM and S-R were compared to those of the 3σ control chart. The comparative analysis of determination methods for count rate data was carried out in terms of the false positive incidence rate and the coefficient of variation (CV).
Materials and Methods
1. Count rate data for statistical analysis
Count rate data sets in time series were collected from 5 monitoring posts in tidal observatories, 3 buoy posts, and a seawall post during all the year of 2018. Figure 1 shows the schematic diagram of the seawater radioactivity monitoring system installed in a tidal observatory. All of the count rate data were measured every 15 minutes from the region of interest (ROI) for 137Cs (Eγ=661.6 keV) on the gamma-ray energy spectrum. The pulse height spectra observed from NaI(Tl) spectrometry system, which installed at on-line seawater radioactivity monitoring posts, were collected and stored at the central computer server.
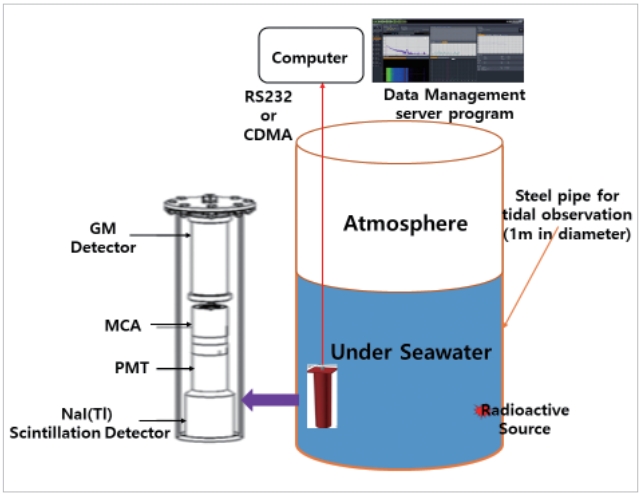
Schematic diagram of the seawater radioactivity monitoring system installed in a tidal observatory.
The region of interest (ROI) was set for 661.1 keV full energy peak within 51 channels based on three times the full width half maximum (FWHM) of 17 channels. The most basic definition of background might be the spectrum observed with no radioactive source. However, in spectral analysis, it is customary to include flat continuum by Compton electron scattering. Therefore, the net counts area in the peak are calculated by subtracting a straight line or step background drawn between the endpoints of the ROI. In this study, the end points are averaged over 26 channels for lower energy region and higher energy region centered the peak ROI, respectively. While the gross counts area in the peak means the total area without subtracting the background counts area, shown as Figure 2A. The peak area (counts) corresponding to the 137Cs gamma energy of 661.6 keV (channel number 226) is calculated from ;
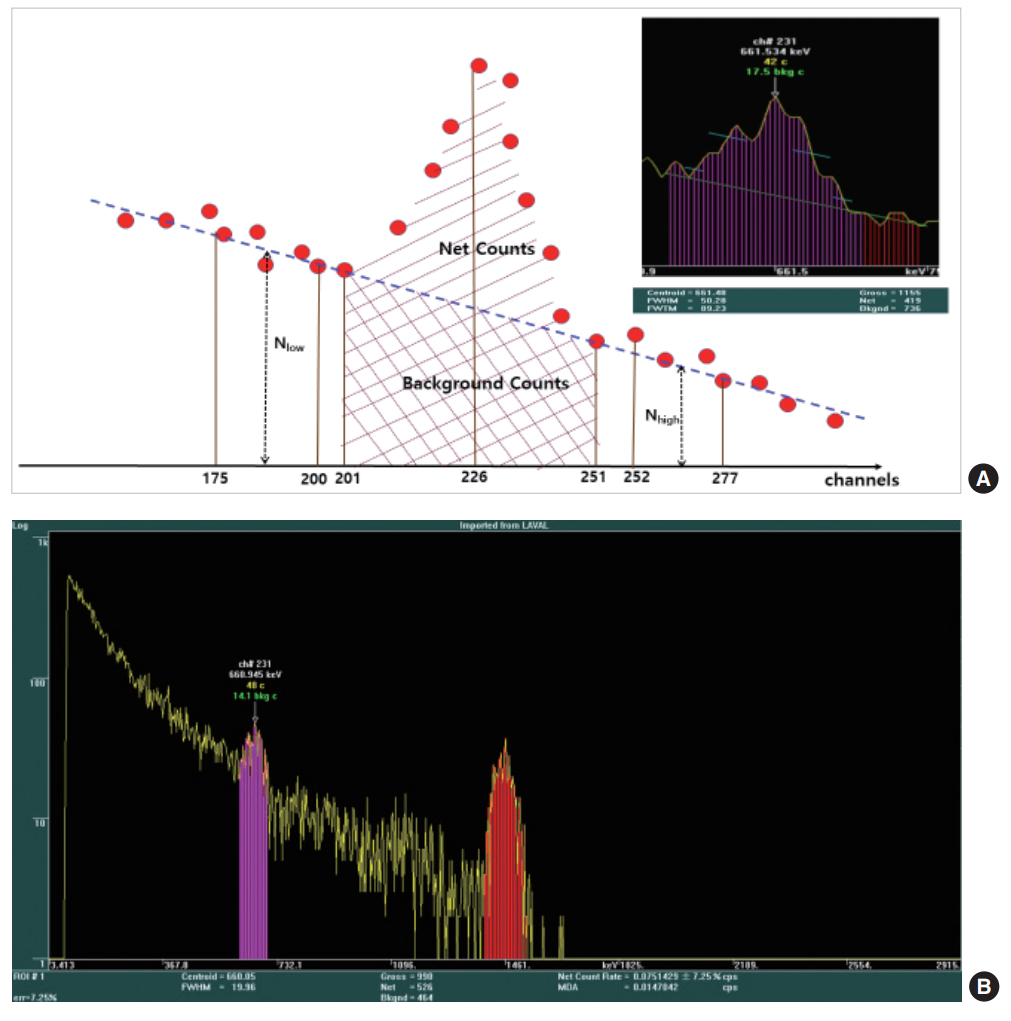
(A) Conceptual scheme of peak area determination in this study and (B) measured gamma energy spectrum of 137Cs radioactive point sealed source in 15 minutes under the seawater.
Figure 2B shows the peaks of 137Cs (661.6 keV) and 40K (1,460 keV) on the gamma energy spectrum using NaI(Tl) scintillation detector. The 137Cs radioactive point source (~37 kBq, reference data of 1-May-2015) was used to experimentally characterize the response of the detector under the seawater. The source was placed with a distance of 40 cm between source and detector, as shown Figure 1. All statistical algorithms were developed using R Programming by the authors.
2. Statistical control charts
The Shewhart (3σ) control charts is a classical statistical process control (SPC) procedure applied for monitoring the process mean. For 3σ control charts in this study, count rate data are plotted in time series and each point is compared to control limits three standard deviation (σ) above and below the mean count rate (μ). The system is designated as out-ofcontrol if a data points falls outside of μ+3σ limits. This method has average run length (ARL0) of 741 and theoretical false positive rate (α) of 0.135% [4]. The ARL0 is the average number of data points that must be acquired before a shift is detected and out-of-control alarm is issued.
The CUSUM control chart were first introduced by Page [9]. He proposed that a decision about changes in a process should not be based on a single observation but all the observations that had been obtained up to the time of testing. The information from the new sample data should be combined with past data to provide an indication of a possible shift in the process level. In this study, the CUSUM statistic is the cumulative difference between or the ith count rate (CRi) and a Gaussianized reference value (k). Which is defined as k=δ/2 where δ is the size of the shift to be detected. The system is designated as out-of-control when the deviation between CRi and k is greater than the control limit (h) [10]. For our radiation monitoring, a one-sided upper CUSUM statistic is used because we are only interested in an increase of the deviation. The upper CUSUM statistic (ci) is calculated as
An upper CUSUM scheme with parameters k=0.5 and h=4.77 calculated using the Siegmund approximation corresponded to ARL0=741 (α=0.135%), which is the same as the 3σ control chart [4].
Bayesian statistics allows for the formal incorporation of prior subjective knowledge, belief, and information beyond that contained in the observed data in the inference process via Bayes’ theorem. Therefore, it has been proposed as an alternative statistical method for analyzing low-level radioactivity in the presence of background counts. Bayesian statistics allow prior information about net and background count rates beyond that contained in the observed data to be included in the analysis. The Bayesian S-R control procedure has been studied as a possible alternative to the more commonly used SPC schemes. The components of the changepoint detection problem are a sequence of observations {Xi} whose baseline distribution has a density f0 that may change to a density f1. The change-point ν is unknown and can take place at any 1≤ν<∞. ν=∞ denotes the case where a change never occurs. A detection scheme is characterized by stopping time N, at which an alarm is sounded. The basic S-R statistic and stopping time are respectively
The Bayesian detection framework could be derived using Bayes’ theorem and the S-R statistic (Wm) is calculated by
Where Ri is the likelihood ratio. For the case Gaussian distributions estimate the likelihood ratio, the S-R statistic becomes
Where CRj is the jth count rate measurement, δ is the size of the shift to the detected, and m is measurement number and n is the number of samples collected per data point. S-R parameters were δ=3 and n=1. Control limits were set to Wstop =700 [11], which is similar to the 3σ control chart.
Results and Discussion
1. Comparison of control chart methods
The Shewhart (3σ), CUSUM, and Bayesian S-R control chart methodologies were applied to each of annual data sets of count rate collected from 5 seawater radioactivity monitoring posts in tidal observation facilities and false negative incidence rates were evaluated. Figure 3 shows a typical 3σ, CUSUM and S-R control charts for a net count rate of annual background data set archived every 15 minutes all the year of 2018. The false positive incidence rates for the three methods are presented Figure 4. The 3σ method resulted in the most false positive incidence while the S-R method resulted in the fewest. An alarm of the 3σ method occurs when a single count rate exceeds the mean value (μ0) by more than three times the standard deviation (σ) in the background count rate. The probability of a count rate value outside of the 3σ control limit is 0.27%, which corresponds to an UCL of 0.135%. In the other words, the 3σ method has the theoretical false positive rate α=0.135% or a predicted average run length (ARL0) of 741. The 3σ analyses resulted in the average false positive incidence rate of 0.164±0.047% based on annual data points at 5 monitoring posts listed in Table 1. The mean value is a slightly greater than the expected value of 0.135%. Experimental false positive rates did not agree with theoretical rates, because the experimental sampling size was a finite subset of the sampling population while the theoretical sampling size was assumed to be the whole sampling population and the experimental conditions for measuring a background count rate were a slightly different every monitoring posts.
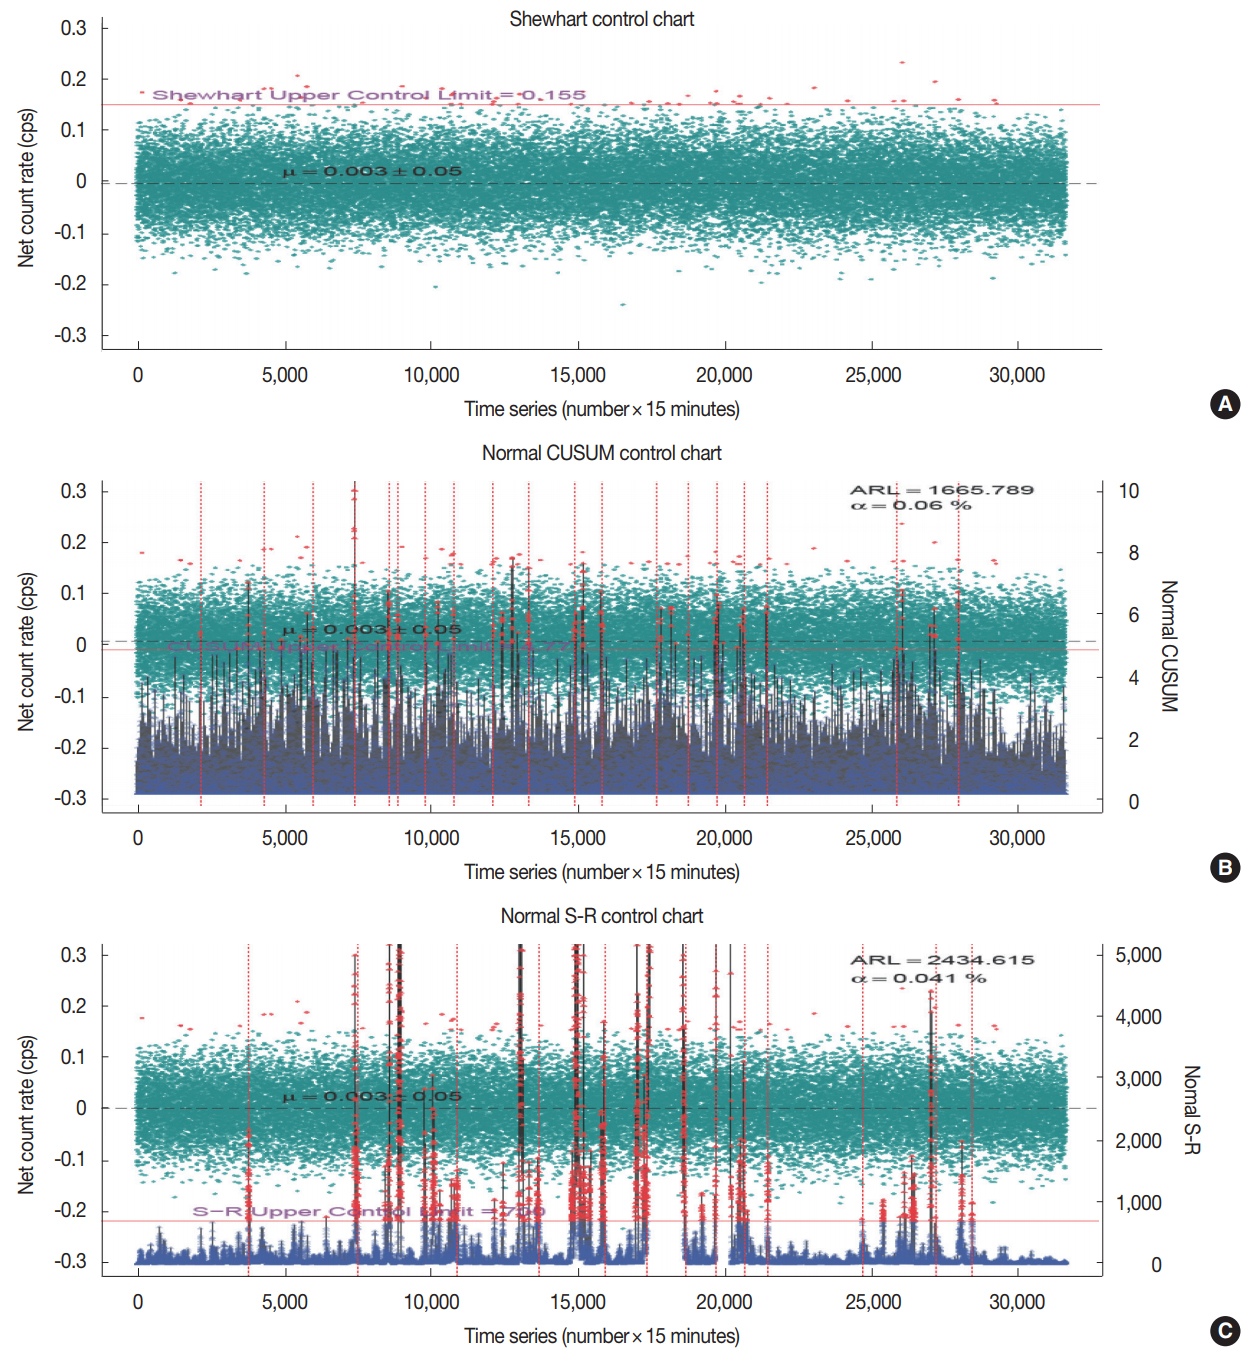
(A) 3σ control chart (•net count rate data points), (B) CUSUM control chart (|CUSUM statistics values), and (C) S-R control chart (+S-R statistics values) for net count rate of annual background data set at a monitoring post.
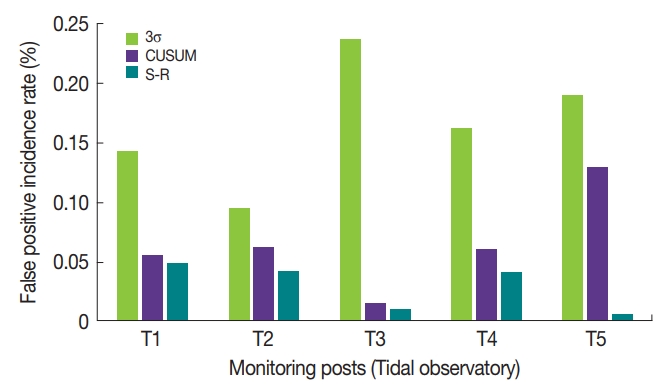
Comparison of the false positive incidence rate for 3 statistical control charts each monitoring post.
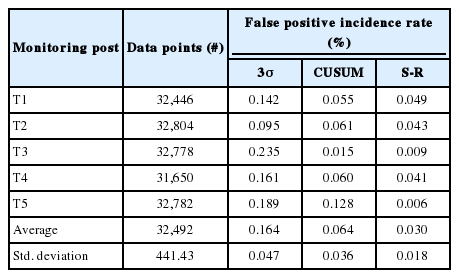
Comparison of False Positive Incidence Rates for 3σ, CUSUM, and S-R Control Chart Based on Annual Data Points at 5 Monitoring Posts
The CUSUM and S-R analyses resulted in an average false positive incidence rate of 0.064±0.036% and 0.030±0.018% based on the above data points in the time series, respectively. The S-R method has a lower value than that of the CUSUM method, because the Bayesian S-R method use the information to evaluate a posterior distribution, even though the CUSUM control chart accumulate information from recent data points. Based on these results, we may conclude that the best statistical method in terms of triggering an alarm when a datum point falls outside of the UCL is the S-R method. It was well known that the 3σ control chart is relatively insensitive to small changes, which consequentially decreases the likelihood of incurring false positive detections.
2. Net count rate and gross count rate
Two different methods described earlier were applied to the determination of count rate in this study. The false positive incidence rate was evaluated using the 3σ control chart. Figure 5 shows the 3σ control charts of net count rate and gross count rate which measured in time series all the year at a monitoring post. For net count rate of 0±0.04, the corresponding UCL was calculated to be 0.119 cps and the false positive incidence rate was 0.142%. For gross count rate of 0.721±0.062, the corresponding UCL was calculated to be 0.907 cps and the false positive incidence rate was 0.219%.
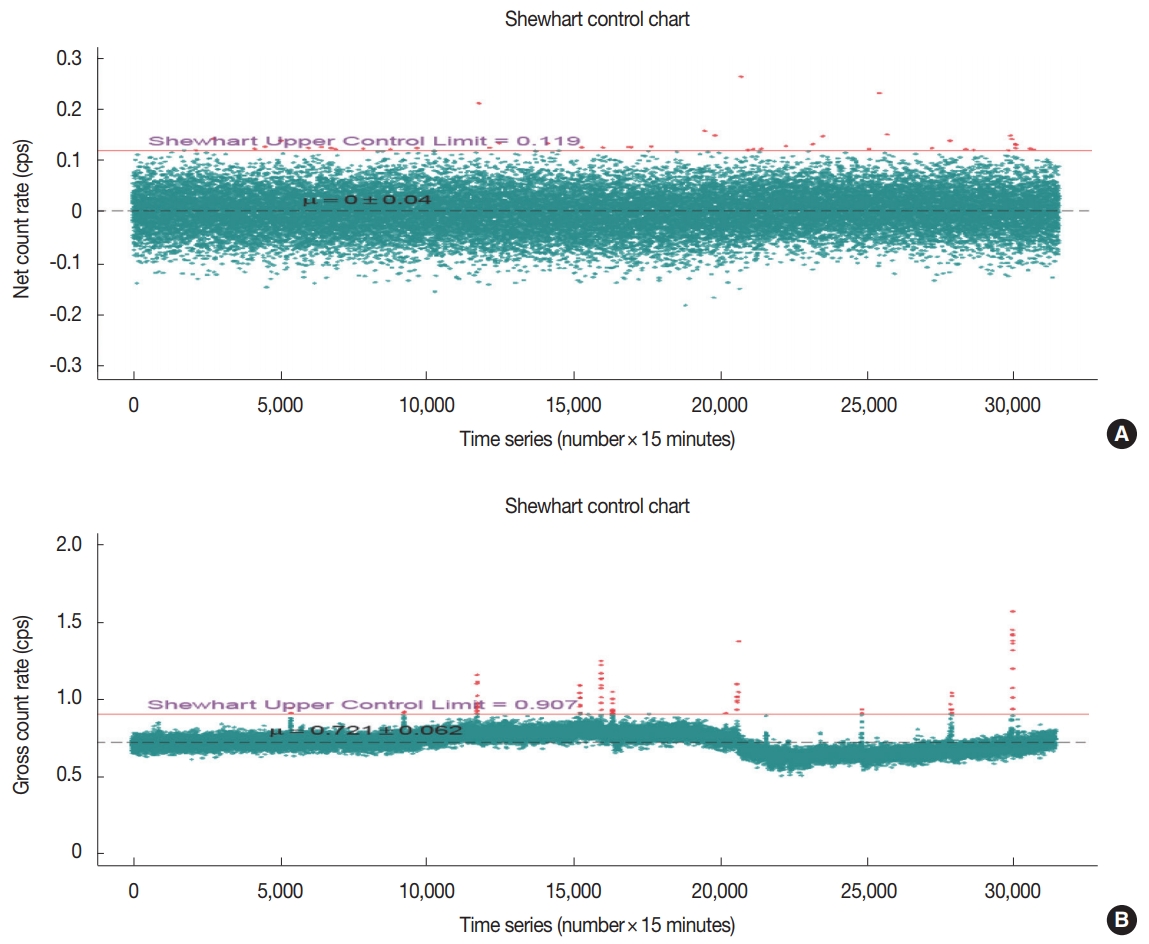
3σ control charts for (A) net count rate and (B) gross count rate.
The coefficient of variation (CV) of the gross count rate and the false positive incidence rate for each monitoring post are presented in Figures 6 and 7, respectively. These figures illuminate the fact that the gross count method has a large difference between monitoring installation sites because of different background continuum in the gamma energy spectrum due to various environmental factors. For this reason, the gross count method is not suitable for on-line monitoring networks nationwide. Based on these results, we may conclude that the net count method is better than the gross count method because of relatively a small variation in the data points.
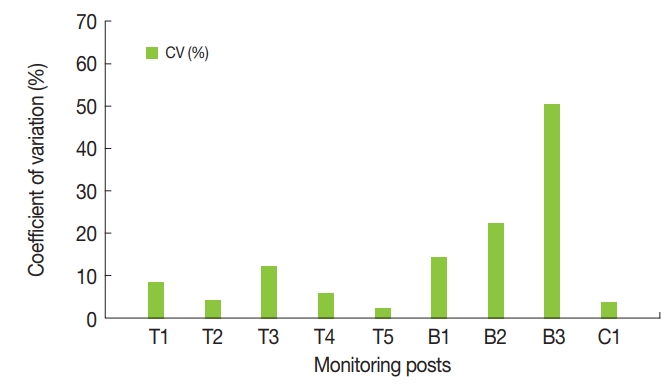
Comparison of the Coefficient of Variation (CV) of the gross count rate for each monitoring post.
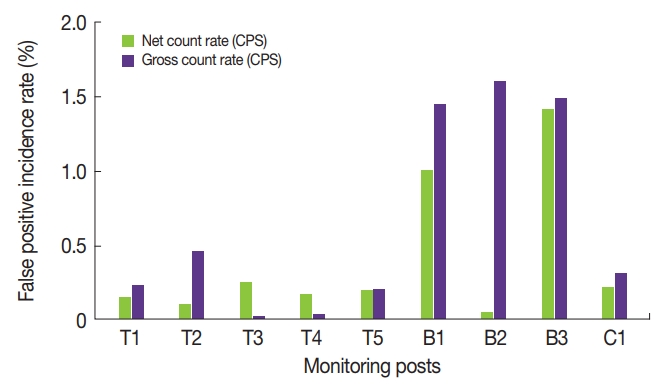
Comparison of the false positive incidence rate for each monitoring post between net count rate and gross count rate.
Conclusion
For the case of low level radioactivity, statistical fluctuations in the gamma energy spectrum measured from NaI(Tl) spectrometry system make identifying and quantifying an artificial radionuclide very difficult. A critical level of concern above which action is warranted must be specified to minimize the risk of both Type I and Type II errors. Thus, the Shewhart (3σ), CUSUM, and Bayesian S-R control chart methods were evaluated in this study in order to make a proper process for triggering out-of-state from changes.
Bayesian S-R and CUSUM control charts are better suited for on-line seawater radioactivity monitoring with an count rate data in time series than 3σ control chart. However, it requires a continuous increasing trend to differentiate between a false positive and actual radioactive contamination resulted from artificial radionuclides. If the value of count rate has not a consistent continuous increasing trend, we could mistake the alarm as a false positive and miss detection of a nuclear event, although a work burden is reduced in our routine task. For the determination of count rate, the net count method is better than the gross count method because of relatively a small variation in the data points. However, the gross count method seems to an advantage in finding an unstable operation of monitoring system by a channel shift due to temperature gain drift.