Temporal Change in Radiological Environments on Land after the Fukushima Daiichi Nuclear Power Plant Accident
Article information
Abstract
Massive environmental monitoring has been conducted continuously since the Fukushima Daiichi Nuclear Power accident in March of 2011 by different monitoring methods that have different features together with migration studies of radiocesium in diverse environments. These results have clarified the characteristics of radiological environments and their temporal change around the Fukushima site. At three months after the accident, multiple radionuclides including radiostrontium and plutonium were detected in many locations; and it was confirmed that radiocesium was most important from the viewpoint of long-term exposure. Radiation levels around the Fukushima site have decreased greatly over time. The decreasing trend was found to change variously according to local conditions. The air dose rates in environments related to human living have decreased faster than expected from radioactive decay by a factor of 2–3 on average; those in pure forest have decreased more closely to physical decay. The main causes of air dose rate reduction were judged to be radioactive decay, movement of radiocesium in vertical and horizontal directions, and decontamination. Land-use categories and human activities have significantly affected the reduction tendency. Difference in the air dose rate reduction trends can be explained qualitatively according to the knowledge obtained in radiocesium migration studies; whereas, the quantitative explanation for individual sites is an important future challenge. The ecological half-lives of air dose rates have been evaluated by several researchers, and a short-term half-life within 1 year was commonly observed in the studies. An empirical model for predicting air dose rate distribution was developed based on statistical analysis of an extensive car-borne survey dataset, which enabled the prediction with confidence intervals. Different types of contamination maps were integrated to better quantify the spatial data. The obtained data were used for extended studies such as for identifying the main reactor that caused the contamination of arbitrary regions and developing standard procedures for environmental measurement and sampling. Annual external exposure doses for residents who intended to return to their homes were estimated as within a few millisieverts. Different forms of environmental data and knowledge have been provided for wide spectrum of people. Diverse aspects of lessons learned from the Fukushima accident, including practical ones, must be passed on to future generations.
Introduction
More than eight years have passed since the Fukushima Nuclear Power Plant (NPP) accident happened. Enormous areas were affected by the deposition of the released radionuclides, and exposure to the public has continued from some radionuclides that have long half-lives [1]. A large number of residents were forced to evacuate from the affected areas and to live in areas having less contamination. For several reasons including intensive decontamination activities, the radiation levels have significantly diminished during these eight years. Also, evacuation orders have been lifted steadily, although it is anticipated that it will take a considerable time before all such orders are lifted from all areas.
In order to assess the impact of the Fukushima accident and make decisions for protective and remediation actions, comprehensive monitoring data have been obtained by national projects for large-scale environmental monitoring [2, 3]. The monitoring has covered mainly within 80 km of the Fukushima NPP, in which the contamination levels have remained relatively high, while wider areas have been targeted by aerial and car-born surveys, which are able to obtain data for large areas in a short time. The large-scale environmental monitoring continuously performed in the national projects has provided a large amount of important information, and the analysis of the obtained data helped characterizing the contamination conditions in Fukushima and their temporal changes [4–6]. Meanwhile, migration of radiocesium has been studied in several projects to clarify the underlying mechanism of change in radiation levels [2, 7, 8]. The results of these projects have made it possible to image on how radiocesium has migrated in the environment around the Fukushima site.
In this paper, we aim to provide an overview of the environmental consequences of the Fukushima NPP accident. We present broad aspects largely based on the knowledge and experience that we obtained directly after the accident, and also based on information collected from other studies. We first briefly review the large-scale environmental monitoring activities implemented after the accident. Then, we discuss characteristics of the initial contamination conditions, summarize subsequent changes, introduce several related studies of the accumulated environmental data, and discuss external exposures of residents. In addition, various forms of preservation and provision of environmental data are described. In the final section, we summarize the contents and indicate future challenges.
Large scale environmental monitoring after Fukushima NPP accident
Extensive environmental monitoring, under diverse measurement conditions, has been implemented by various organizations and individuals. In this paper, we focused on two national projects that were implemented systematically at a large scale and have produced highly reliable data [2, 3]. The Fukushima mapping project, which aimed at obtaining comprehensive monitoring data on land, was launched three months after the accident, and several different types of measurements for air dose rates and radionuclide deposition have been conducted continuously since the time [2]. Aerial surveys by helicopter, which were started as a separate project before the mapping project, have been conducted repeatedly across wide areas of eastern Japan [3].
1. Air dose rate
In this paper, the air dose rate means the ambient dose equivalent rate in μSv·h-1. For its measurement, the main monitoring methods used in the two national monitoring projects are listed in Table 1. Also, more than 3,000 new monitoring posts were set up by the Japan Ministry of Education, Culture, Sports, Science and Technology (MEXT) after the Fukushima accident have provided sequential air dose rates in addition to data obtained by prior monitoring stations and posts. The new posts were aimed to obtain air dose rate data mainly at places related to children, such as kindergardens and schools. Each monitoring method has its specific features, and several aspects were evaluated (Table 1) on the basis of experiences gained in the Fukushima accident: data accuracy, positional resolution, regional coverage, and temporal coverage. A larger score in the table indicates relatively higher evaluation. Figure 1 shows images of air dose rate distributions measured using different methods.

Evaluation of Measurement Methods Used in Large-Scale Environmental Monitoring Based on Experience After Fukushima Accident. Higher score indicates higher rank in evaluation

Images of air dose rate distribution maps created by different monitoring methods. (A) Fixed-location measurement. (B) Unmanned-helicopter survey. (C) Car-borne survey. (D) Helicopter survey.
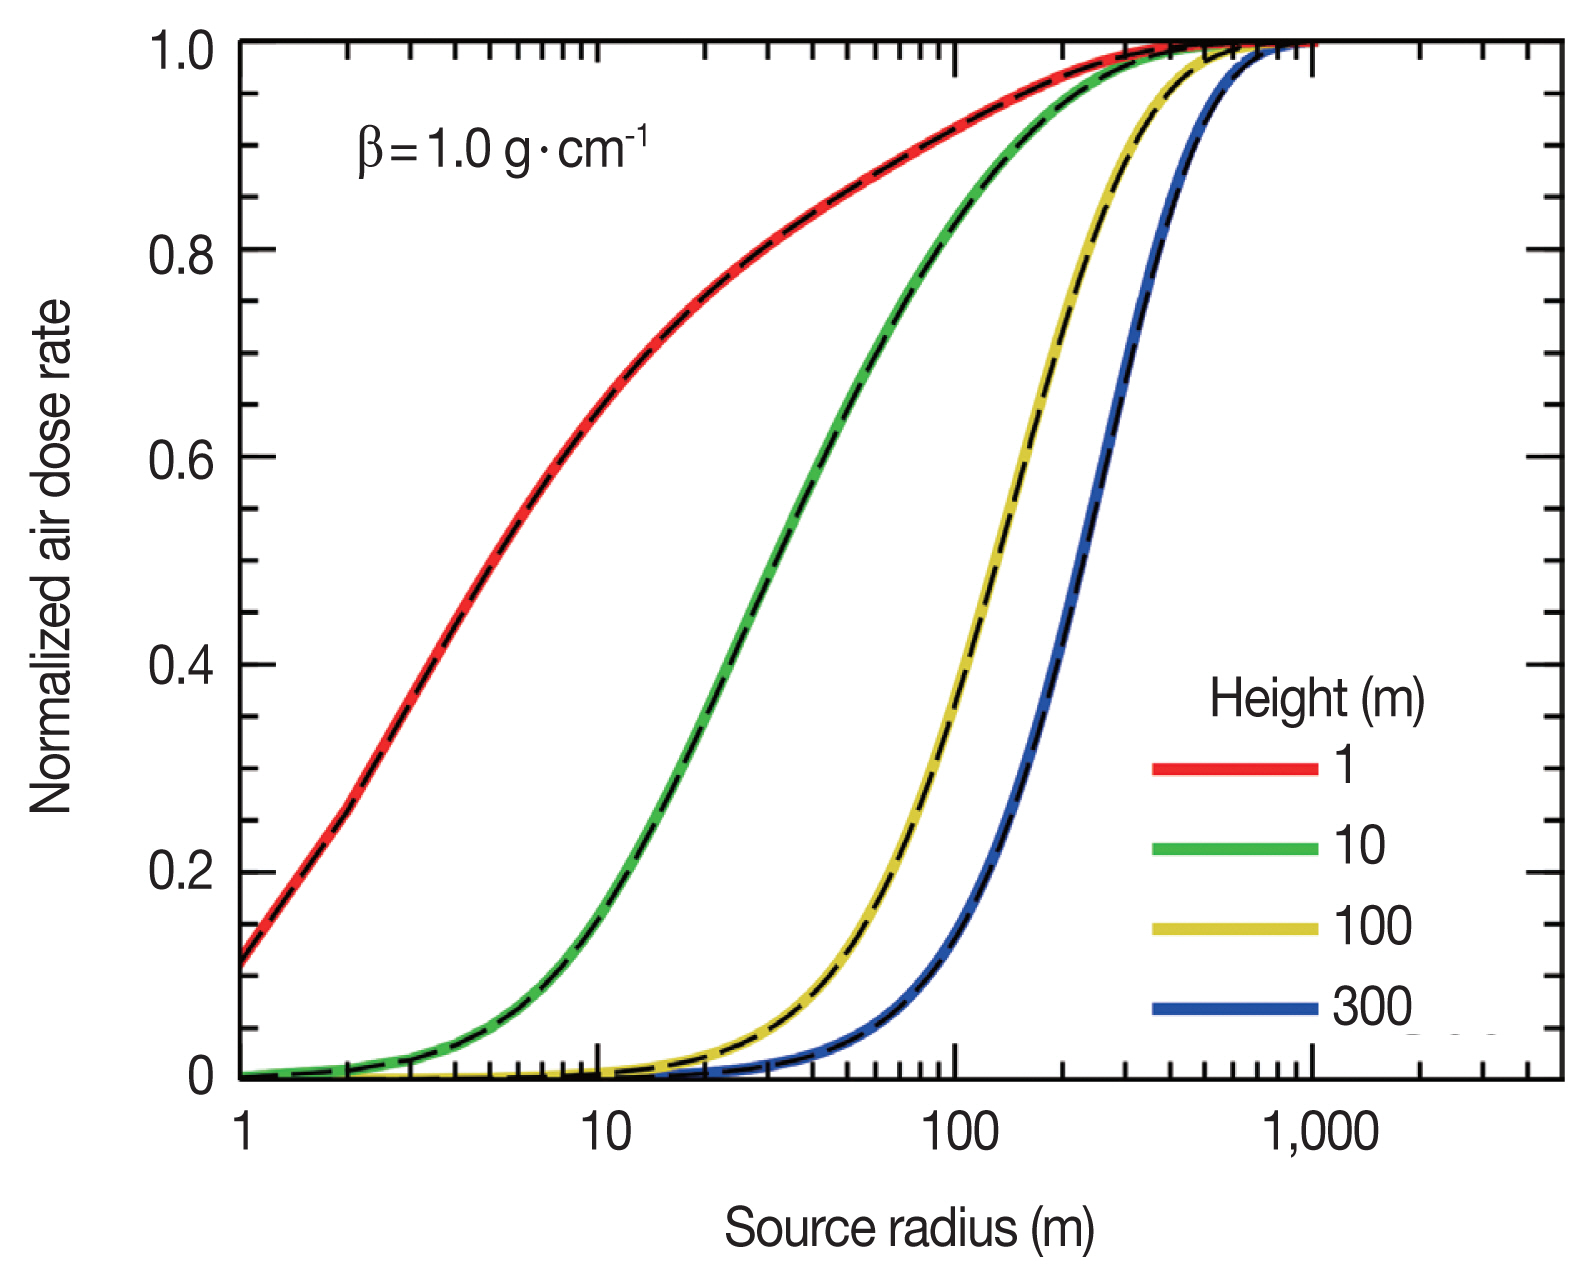
Figure 2 shows a plot of air dose rates at different heights from ground-deposited radiocesium with a relaxation mass depth of 1 g·m−2 calculated by Monte Carlo simulation [9]. Each line shows air dose rates due to radiocesium within arbitrary radial distances as a fraction of total air dose rate. At 1 m height, 90% of the air dose rate is attributed to gamma rays from the ground source within ~80 m radius; whereas, at 300 m height, 90% of the air dose rate is due to the ground source within ~470 m radius. Accordingly, helicopter surveys can detect gamma rays across a wide area in a short time; however, the positional resolution of helicopter surveys is low.
Fixed-location measurements using well-calibrated portable survey meters provide standard air dose rates at the selected representative locations [10], but the regional coverage of obtained data is small compared to that of other mobile monitoring methods. Monitoring stations and posts give a similar limited regional coverage, but they can provide temporally continuous data, which is a significant feature that the other monitoring methods do not have. Walk surveys aim to cover various locations related to human activities and obtain air dose rates that are essential for assessing exposure doses of residents [11]. However, the regional coverage is not large because the range that a person can cover on foot is limited.
Although the regional coverage of car-borne surveys is much larger than those of other methods mentioned above, the area that one car can cover in a short time is limited. After the Fukushima accident, about 100 car-borne survey systems were used at the same time, and air dose rates over eastern Japan were measured in a short time [12] by applying the recently invented Kyoto University radiation-mapping (KURAMA-II) system, which can collect data from a number of cars automatically through a mobile-phone network [13]. The G(E) function for compensating the energy response of a CsI detector used in the KURAMA-II system was developed [14], and the performance of the KURAMA-II system was verified using standard sources [15]. Also, the KURAMA-II systems were installed in public buses which run fixed routes in Fukushima, and the obtained data are published every week on a specific web site. Because this kind of measurement provides time-dependent air dose rate data, the temporal coverage of the data is larger than that of other mobile surveys. That is why the temporal coverage of car-borne surveys was given a higher score than those for other methods except for monitoring stations and posts. However, air dose rates measured by car-borne survey are slightly smaller than those in the surrounding environments [16].
Aerial surveying using helicopters are a superior method that can cover any targeted areas in a short time [3]. Flight lines are set densely at a certain interval so that the results can be properly interpolated. The interpolated results are generally used as basic data to construct a smooth contamination map. However, as previously mentioned, positional resolution of so obtained data is low. The data accuracy is not very high because the measured data at a high altitude must be converted to the air dose rate at 1 m height. In the Fukushima accident, helicopter-survey data tended to be systematically a little higher than those measured on the ground [17, 18]. According to our experience, aerial data are useful for integrating with on-ground data as discussed later. Current researches to improve the method of aerial data conversion is expected to result in more accurate converted data in the future [19].
Unmanned helicopter surveys are considered to be supplemental to conventional helicopter survey. Because an unmanned helicopter flies at a lower altitude than a conventional helicopter, the positional resolution and data accuracy are higher. After the Fukushima accident, the area within a radius of 3–5 km around the Fukushima Daiichi NPP where it was difficult to enter on foot was monitored by unmanned-helicopter surveys [20].
Since the Fukushima accident, air dose rates have been monitored at a large scale using several different methods, as discussed above. Each method and its results have the specific features, and the results have different characteristics. In accident cases, multiple monitoring methods appropriate to the conditions should be used in parallel.
2. Radionuclide ground deposition
The amount of radionuclide ground deposition is expressed in two different ways: 1) radionuclide deposition density per unit ground area (Bq·m−2), or 2) radionuclide concentration per unit soil mass (Bq·kg−3). The former quantity is obtained to integrate the later quantity over the depth, and can be an indicator of the total deposition amount at a location regardless of the depth profile. It is also a basic quantity with respect to dose evaluation and widely used in the past to indicate radionuclide deposition [21]. Deposition density will be addressed herein when we discuss the deposition amount at a location.
The deposition density is obtained in two different ways, by soil sampling and analysis in a laboratory or in situ spectrometry. The former method can be applied in any cases where radionuclides are emitting alpha, beta, or gamma-rays, whereas the latter method is available only for gamma-emitting radionuclides. Therefore, after a severe accident, large-scale soil sampling and analysis needs to be performed at least once [22]. In situ spectrometry is quite useful if the dominant radionuclides are determined to be gamma-emitting nuclides [23, 24]. It can quantify the average deposition density at a location by detecting gamma-rays coming from a wide area, even though the deposition density fluctuates variously at a small scale, especially in a highly contaminated location. Large-scale soil sampling conducted three months after the Fukushima accident confirmed that dominant radionuclides contribution to public-exposure doses are radiocesium [22]. Subsequently, in situ spectrometry using a portable Ge detector was performed to determine deposition density distributions.
In the first campaign of the mapping project in June 2011, more than 11,000 soil samples were collected at more than 2,200 locations within a 100 km radius of the Fukushima NPP site and from the rest of Fukushima Prefecture [22]. In the second campaign, started from December 2011, the targeted monitoring area was broadened after helicopter surveys revealed that the contamination spread across wide areas in eastern Japan [2]. At about 1,000 locations covering the whole area where the radiation levels were estimated to be higher than 0.2 μSv·h−1, in situ spectrometry was performed. According to the results from the second campaign, it was confirmed that the significantly contaminated areas are mostly within the 80 km zone. Therefore, subsequent monitoring has been concentrated in that zone.
Radionuclide depth profiles, which provide also important information, have been measured repeatedly at more than 80 locations within the 80 km zone since the Fukushima accident [25]. For accurate depth profiles, soil samples at different depths must be collected without cross-contamination, such as a lower-concentration sample being contaminated by a higher-concentration sample. In the Fukushima accident, a scraper plate [26] was used to peel soil incrementally from the ground surface.
Initial contamination conditions
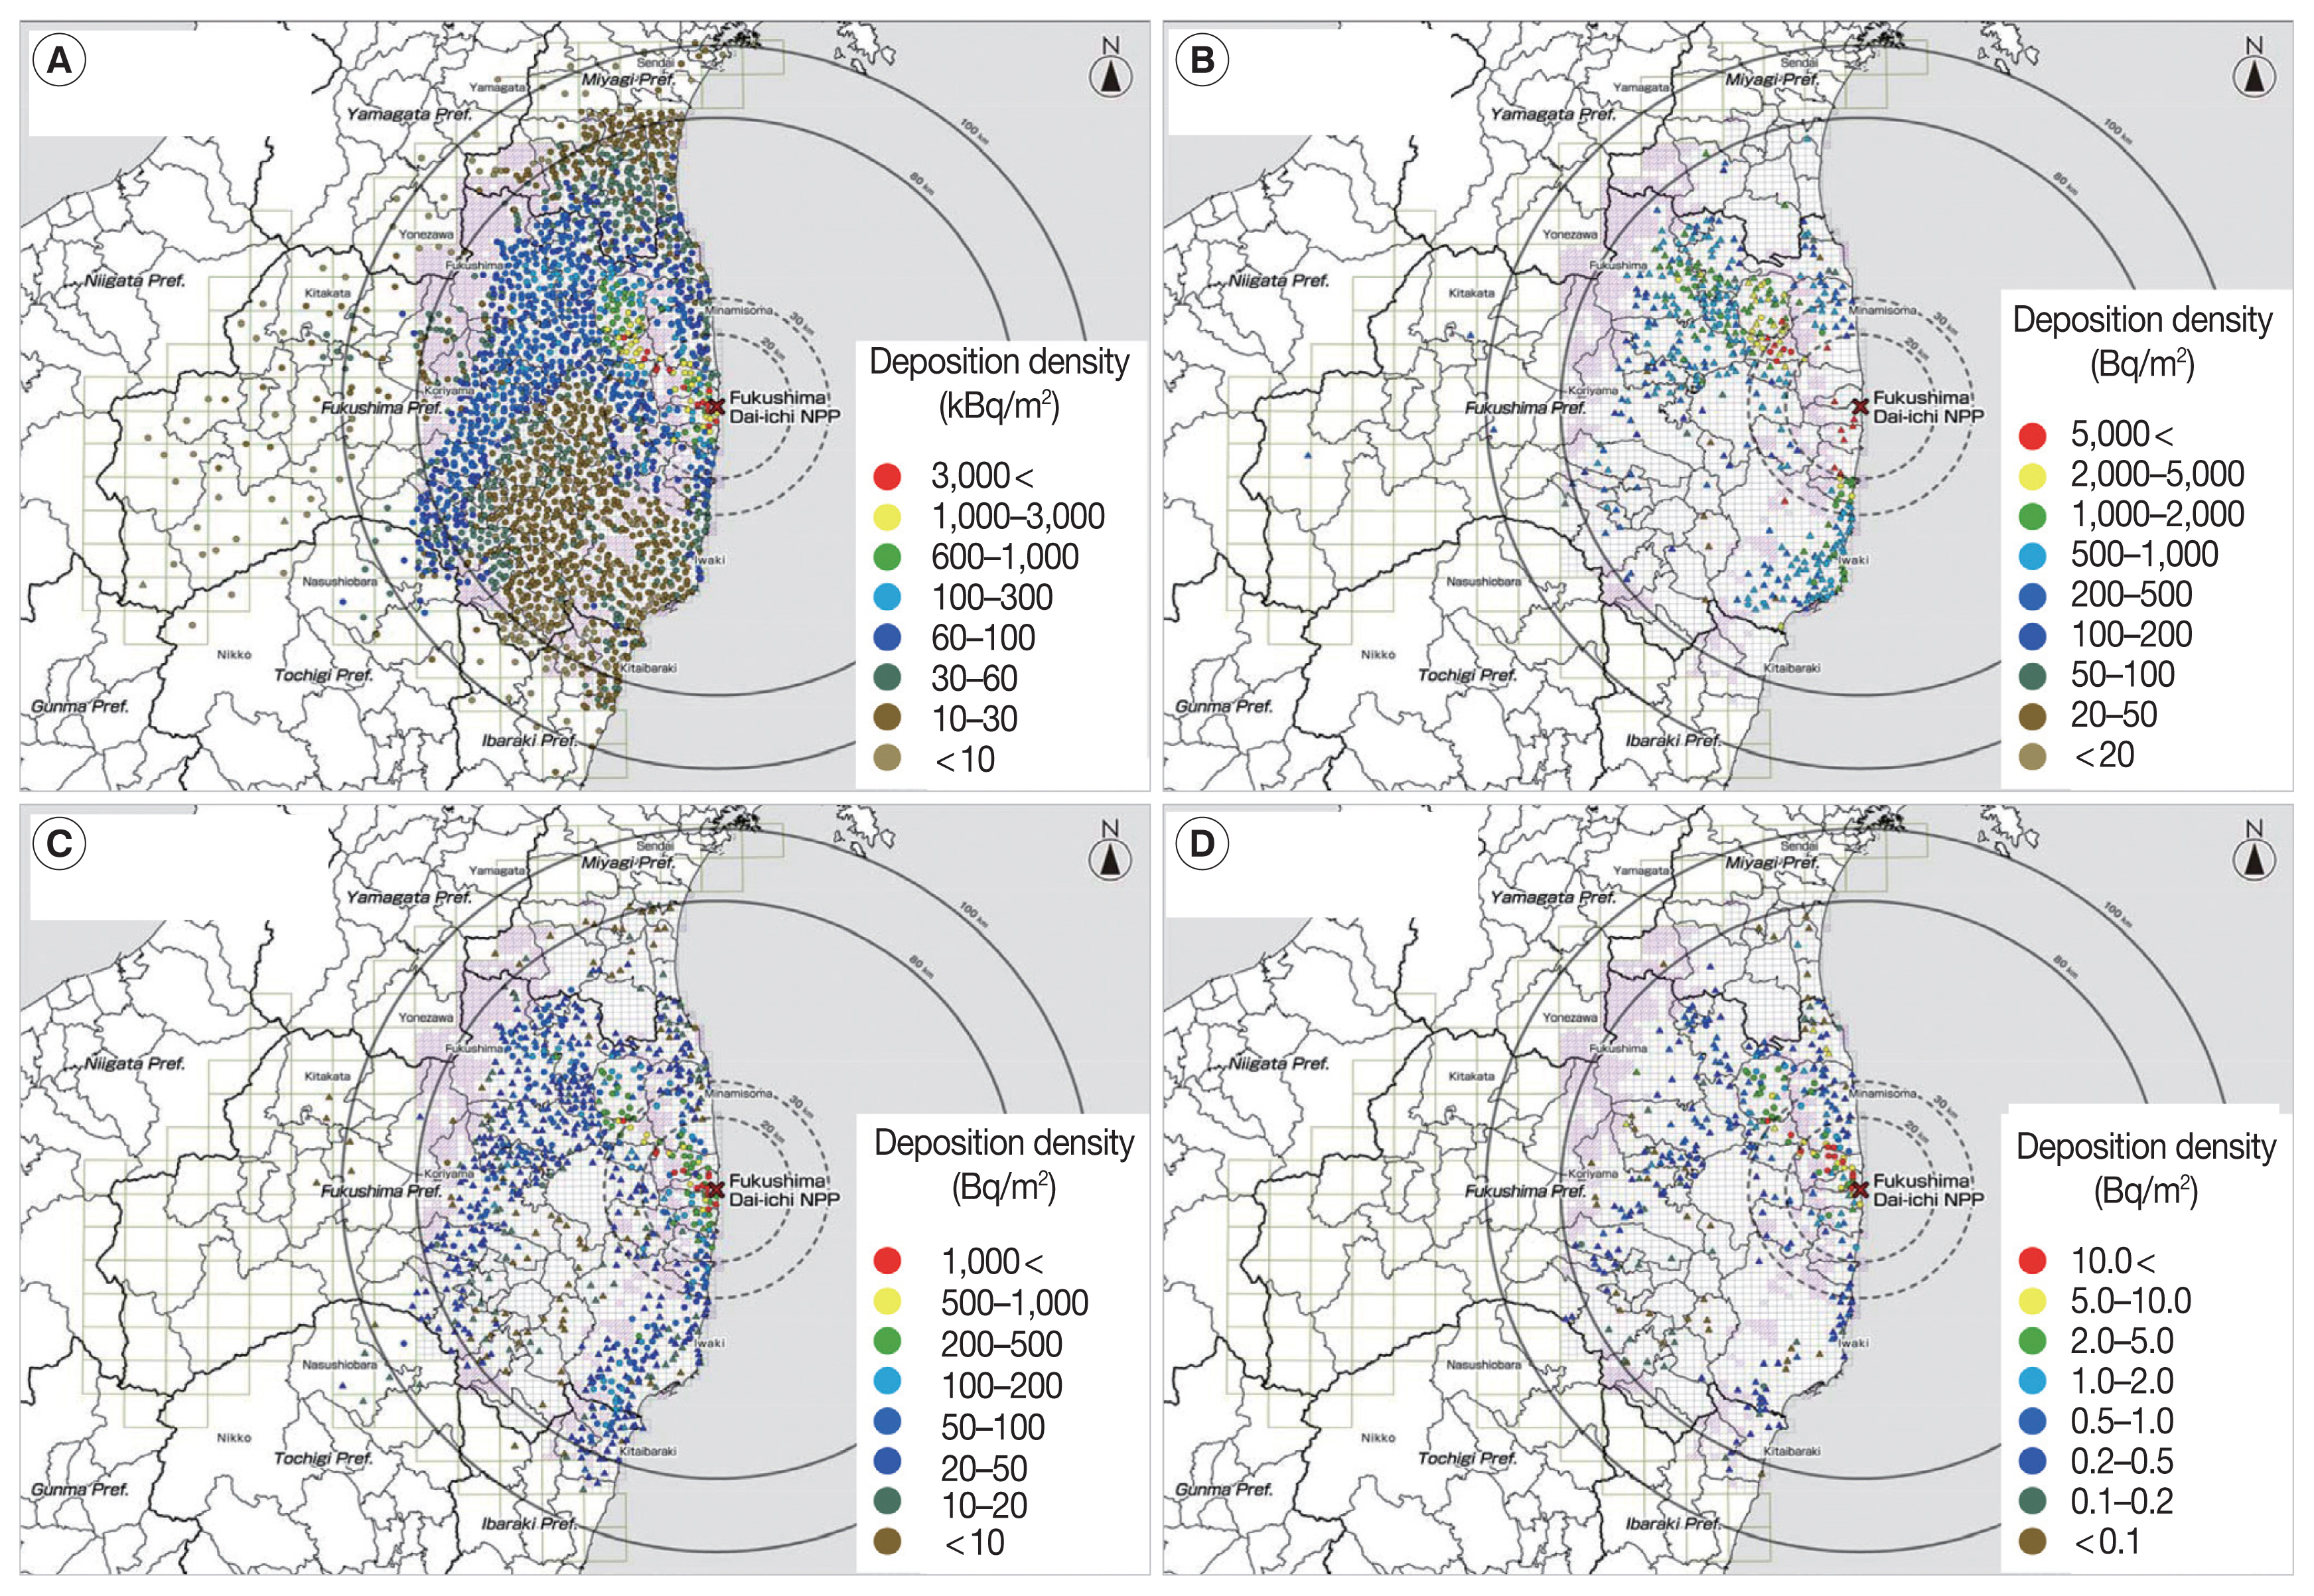
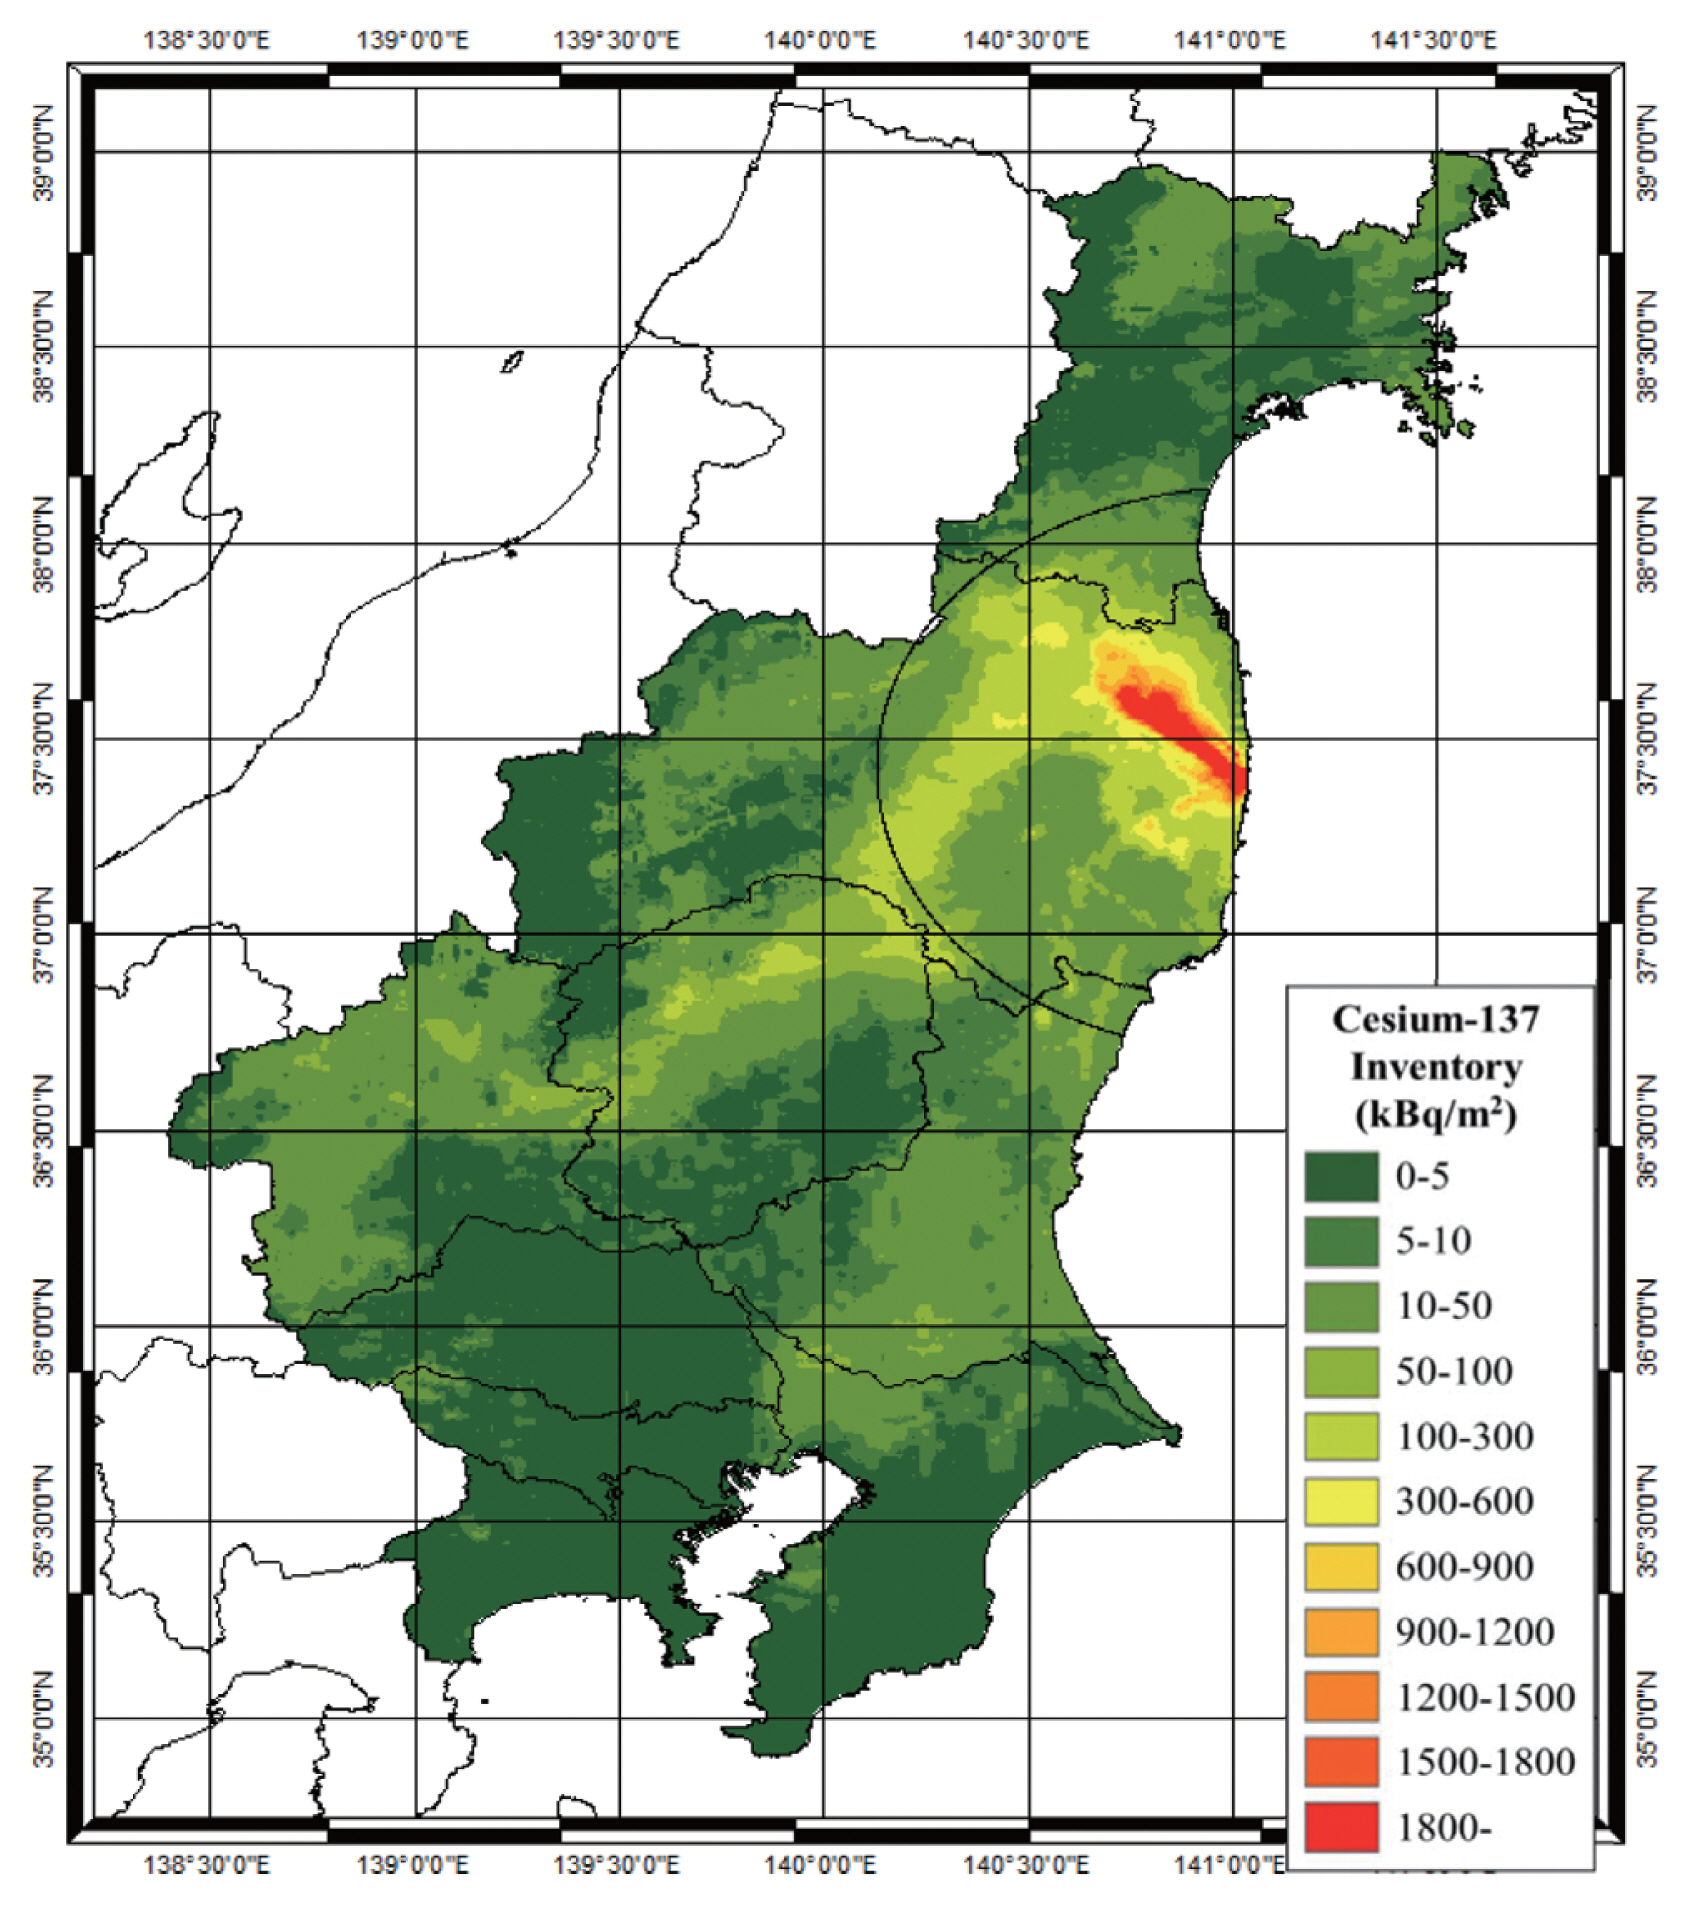
Many radionuclides were released from the Fukushima accident [1]. Among the released radionuclides, the radionuclides detected at many locations after June 2011 were 134Cs and 137Cs; 131I; 129mTe; 110mAg; 89Sr and 90Sr; and 238Pu, 239+240Pu, and 241Pu. The periods during which these radionuclides were detected at many locations are summarized in Table 2. The deposition density distributions of these radionuclides were compiled as contamination maps [22]. Deposition maps for four radionuclides are shown in Figure 3. The maximum deposition density of 137Cs observed during this monitoring was 1.5×10⁷ Bq·m−2 at a location northwest of the Fukushima site. Because the released amounts of 137Cs and 134Cs were similar in the Fukushima accident, the deposition density distribution of 134Cs was also similar to that of 137Cs shown in Figure 3A soon after the accident. The total deposition of 137Cs over the whole of Japan was estimated to be about 2–2.5 PBq [27, 28], which is considered to be 10%–20% of the released 137Cs estimated as 14.5 PBq [29]. The estimation of the total deposition will be explained later.

Radionuclides Detected over Wide Areas, with Periods of Detection and Targeted Areas. ○, detected, X, not detected, –, not measured
From the analysis of radioisotope ratios, it was apparent that some detected radiostrontium and plutonium originated from the Fukushima accident. However, deposition densities were found to be within the range of background radiostrontium and plutonium released from past nuclear-weapon tests [30]. In addition to radiocesium, 110mAg with a half-life of 250 days was detected over wide areas even in 2012 (Figure 4).

The maximum effective doses for 50 years from June 2011 due to the deposited radionuclides were evaluated roughly (Table 3) [22] using the dose coefficients from the International Atomic Energy Agency (IAEA) determined based on conservative simple assumptions [31]. We found that radiocesium is far more important than other radionuclides from the viewpoint of long-term exposure doses. The third important radionuclide following 137Cs and 134Cs was 110mAg; however, the evaluated effective dose was smaller than that from radiocesium by three orders of magnitude. The effective doses due to radiostrontium and plutonium were found to be smaller than that from radiocesium by several orders of magnitude.

Effective Dose for 50 years since June 2011 Due to Ground-Deposited Radionuclides
Although 131I has a short half-life (8.02 days), it was detected at about 400 locations in June 2011 (Figure 1). Because 131I significantly contributed to exposure doses in the early stage after the accident, the map was later improved by applying accelerator mass spectrometry to measure 129I in soil samples collected in June 2011 [32]. Ultimately, 131I deposition densities at about 800 locations were determined on the basis of 129I data and the original 131I data (Figure 5) [33].

From the deposition density and the land-use maps, it was determined that, within an 80 km radius from the site, 70% of radiocesium was deposited in forest, 25% on farmland (including paddies), and 5% in urban areas [27]. The deposition rate was almost proportional to the area of each land use in the entire 80 km zone. Although the 5% deposited in urban areas was not a large proportion, it was considered relatively important because of public exposure. Kato et al. [28] did a similar analysis but targeted the entire contaminated area in eastern Japan and obtained similar results: 72% of radiocesium was deposited in forest; 19% in farmland (including paddies); 5% in building areas. Concerning administrative division, it was estimated that 80% of the radiocesium was deposited in Fukushima Prefecture and the rest was spread across Gunma, Tochigi, Ibaraki, and Miyagi Prefectures.
Temporal change in radiological environments
1. Air dose rate
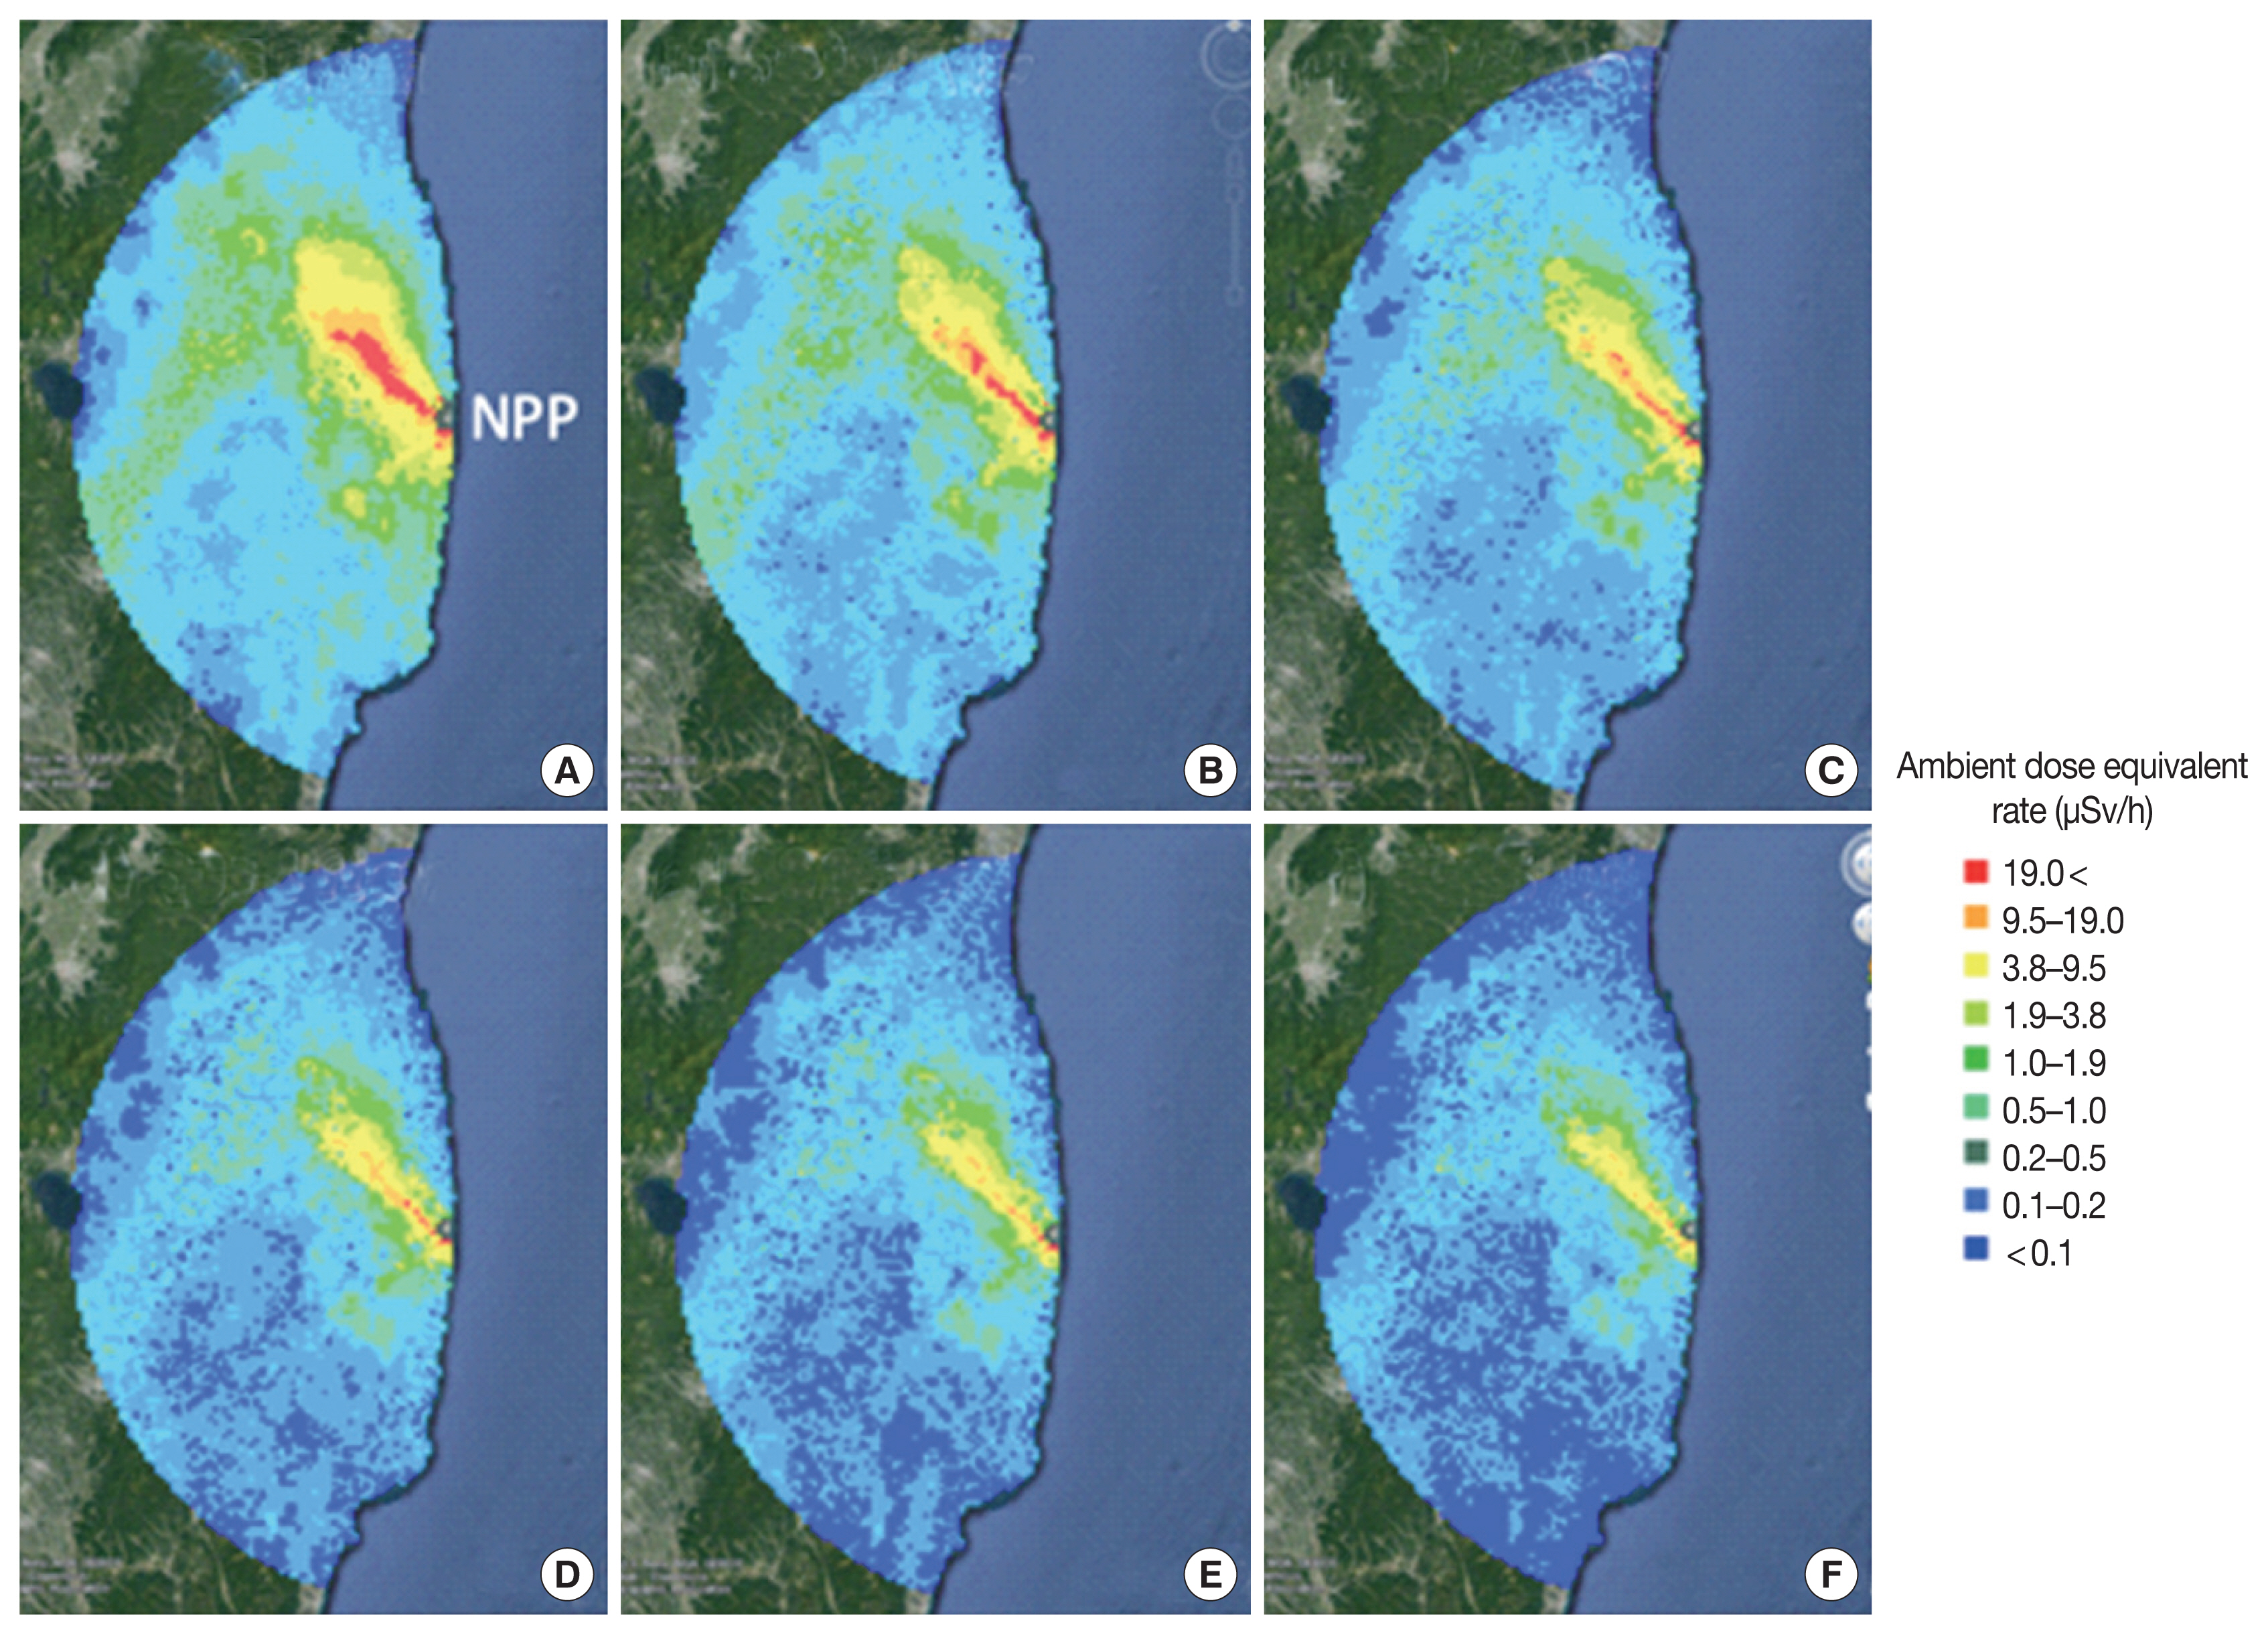
Figure 6 shows the air dose rate distribution maps for different years after the accident constructed by a simple integration of helicopter-survey data and fixed-location measurement data [34]. Air dose rates have decreased greatly since the accident. Average air dose rate by different monitoring methods had different decreasing tendencies, because each monitoring method targeted a different environmental situation. Figure 7 shows the decreasing tendencies of average air dose rates within the 80 km zone measured from fixed-location measurements, car-borne surveys, walk surveys, and helicopter surveys, together with the air dose rate reduction expected from the physical decay [24, 34–36]. The dose rates were normalized to that in June 2011. Air dose rates in environments related to human living were found to decrease much faster than physical decay.

Fixed-location measurements were conducted in undisturbed fields where drastic change in conditions by human activities or by flooding was not expected. However, some measurement locations were later decontaminated, thereby accelerating air dose rate reduction. Car-borne survey data were averaged within 100×100 m2 areas to reduce statistical fluctuations. In car-borne surveys, gamma-rays coming from radiocesium deposited on road surfaces and also on surfaces of surrounding environmental media, such as soil, vegetation and artificial objects, are detected. Radiocesium deposited on artificial structure was found to be easily removed compared to that deposited on natural surfaces [37], as already reported after the Chernobyl accident [38, 39]. Therefore, the air dose rates measured by car-borne surveys showed rapid reduction when compared to those from other types of measurements. It is difficult to draw the same kind of decreasing curve for data collected by walk surveys as they were not launched until 2013. Nonetheless, by comparing data from other types of measurements, we found that the data from walk surveys were expected to lie between those of the fixed-location measurements and the car-borne surveys.
Initiated by the Japanese Ministry of Agriculture Forestry and Fisheries [40] and maintained by University of Tsukuba, measurements at 100 fixed locations in pure forest have been conducted continuously [41]. It was found that air dose rates in pure forest have decreased much more slowly than those in other locations and were rather close to physical-decay rates. When we looked at the data in detail, the decreasing tendency differed according to the species of trees constituting the forest. In evergreen conifer forest, the air dose rates through 2014 decreased somewhat more slowly than that expected from physical decay and then accelerated after 2014. In deciduous broad-leaved or in mixed evergreen-deciduous forest, the decline of air dose rate was 10%–20% faster than for physical decay. These tendencies are explained by radiocesium migration in forest, as discussed later. Because helicopter surveys detect gamma rays from wide areas that include forest, air dose rates by helicopter surveys have decreased more slowly than those derived from other measurements.
As a whole, air dose rates in the environment related to human living have decreased much faster than expected from radioactive decay (Figure 7). In August 2016, the air dose rate decreased to <40% of that in June 2011 by physical decay. The air dose rate in undisturbed fields decreased to about a half of that expected from radioactive decay, and the air dose rate above roads measured by car-borne survey decrease to one-third [34]. Figure 7 is useful to understand general decreasing tendencies in air dose rate. However, it must be noted that the decreasing tendency changes variously according to conditions associated with radionuclide migration.
2. Deposited radionuclides
Figure 8 gives the temporal change in the average deposition density within the 80 km zone for 137Cs and 134Cs in undisturbed fields [34]. In calculating this temporal change, the locations where decontamination was performed or the conditions were changed artificially were excluded. The average deposition density for both 137Cs and 134Cs in undisturbed fields has decreased almost according to radioactive decay. This indicates that migration in horizontal directions was small in undisturbed flat fields. This conclusion agrees with knowledge from migration studies indicating the radiocesium wash-off rate is generally low (<1% of the inventory) [42, 43]. Because radiocesium in Fukushima tends to bind strongly to fine soil particles [44], movement of dissolved radiocesium is limited.
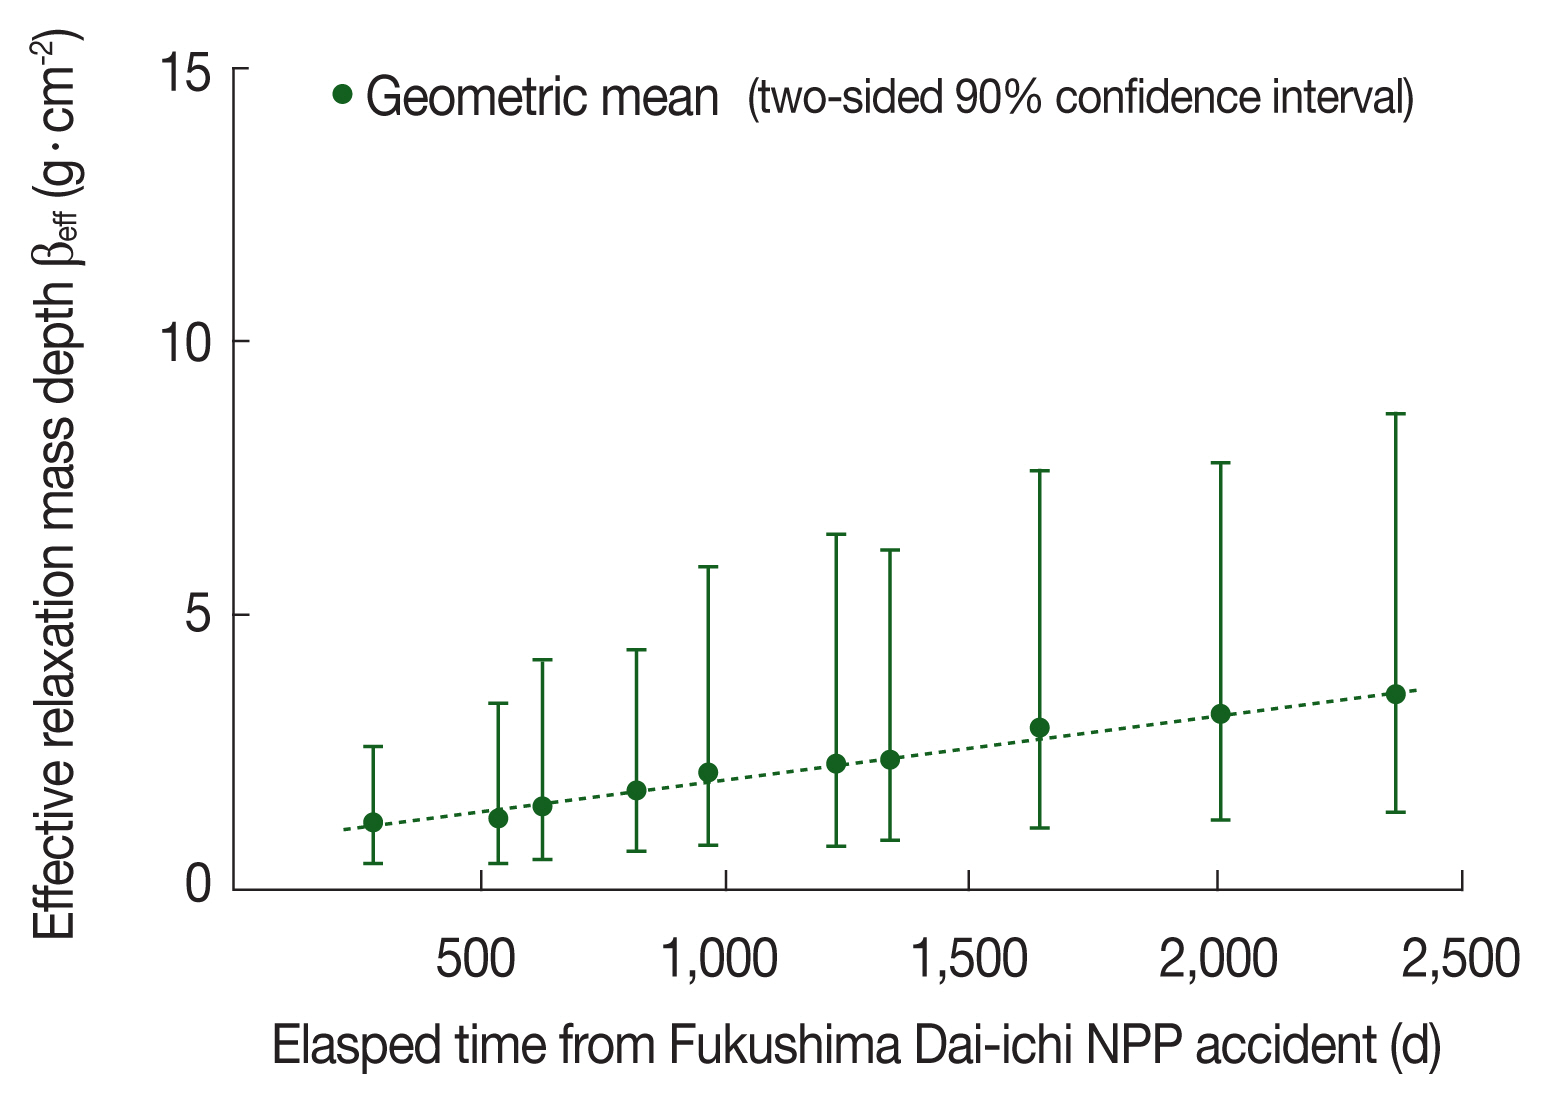
Radiocesium has penetrated into the ground over time. Depth profiles of radiocesium in undisturbed fields have been observed at about 85 locations within the 100 km zone [25]. It turned out that radiocesium depth profiles are either approximated by an exponential function or have a concentration peak at a certain depth. The profile with a concentration peak was found to fit well to a hyperbolic secant function that asymptotically approaches an exponential function with increasing depth [25]. For the whole dataset, the effective relaxation mass depth βeff was evaluated, which is the parameter equivalent to the relaxation mass depth β of an exponential function in terms of air dose rate calculation. Figure 9 shows the time-dependent βeff value. The geometric mean of βeff has increased linearly so far. The 90% depth, defined as the depth down to which 90% of the deposited radiocesium is contained, was calculated for the observed whole profiles. The geometric mean of the 90% depth observed in September 2017 was 4.6 cm; that is, in about half the cases, 90% of radiocesium still exists in the upper 5 cm layer [45].
In contrary, all of the depth profiles observed in forest were subject to an exponential function even though the number of collected samples was not very large [46]. Increase in relaxation depth was not observed in mixed deciduous forest, while a slight increase over time was observed in cedar forest. As a whole, the increase in relaxation depth was not as fast as that in open fields.
In evergreen forest, radiocesium released from the accident was deposited on both canopies and litter layers on the ground, whereas, in deciduous forest, radiocesium was deposited mostly on the litter layers because the trees did not have leaves in March. Radiocesium deposited on canopies has migrated downwards over time by throughfall, stemflow and litter fall [47]. Soon after the deposition, throughfall played an important role in radiocesium removal from the contaminated canopy and resulting migration to forest floor, whereas a few years after the deposition, litter fall became the most important pathway [48]. Now, much of the deposited radiocesium is found near ground level, including in the litter layer and top soil. In cedar forest, the total inventory of radiocesium in the litter and soil layers has increased slightly over time, whereas, in mixed deciduous forest, such trend was not clear [46]. Cesium-137 concentrations and inventories in the litter layer exponentially decreased with time in both forests [46]. These findings agree with the previously described dose rate reduction trend in pure forest. Accordingly, in cedar forest, the air dose reduction was a little slower than physical decay within a few years after the accident, whereas in mixed deciduous forest, it has been a little faster than physical decay [41]. Some of the deposited radiocesium is considered to have recycled within a tree body; trend of radiocesium concentration in leaves and bark was reported to differ according to tree species [48]. In forested environments, radiocesium moves within the forest system and rarely escapes out of the system [49].
In environments related to human living, the migration of radiocesium was found to be fast. It was confirmed that radiocesium deposited on artificial structures such as roads and houses were easily washed off by weathering [37]. In the study of areas where decontamination was not conducted, the average deposition densities of radiocesium on paved ground and roofs relative to that on permeable undisturbed field were observed to be 0.18 and 0.02 at 3.8 years after the accident, respectively. These values are compatible to results of studies of contaminated environments after the Chernobyl accident [38, 39]. This is considered to be a reason why air dose rates in urban environments have decreased faster than those in the other environments.
The migration of radiocesium in fields was found to be generally slow, but the migration has been modified by several factors [43]. For instance, it tends to be suppressed by vegetation. In fields covered with sufficient vegetation, the discharge rate of radiocesium is low, whereas that in the fields with small plants is relatively high. In some test fields, it was observed that radiocesium discharge rate was drastically promoted by weeding, and cultivation tends to accelerate radiocesium migration; in particular, soil puddling before rice planting has played an important role in discharging radioceisum deposited in paddy fields [50]. Therefore, the discharge of radiocesium from farmland contributes significantly to migration of radiocesium at a large scale as discussed next.
Long-distance transport of radiocesium is mostly governed by migration in rivers. Even though the discharge rate of radiocesium from individual land areas is small (generally <1% of deposited radiocesium per year) [43, 50, 51], where a dominant river gathers water from a wide drainage basin, the amount of accumulated radiocesium becomes large. For example, the total discharged 137Cs in the Abukuma River from 2011 to 2015 was estimated to be 12 TBq [43]. Radiocesium is transported in both dissolved and particulate form in water; it was found that particulates contributed the most to radiocesium migration by river water [43, 49, 50]. The radiocesium concentrations both dissolved in water and in the suspended sediments have been decreased drastically in the years since the accident; the normalized radiocesium concentration of suspended sediments declined by one to two orders of magnitude from 2011 to 2016 [50, 51, 52]. The decreasing tendency was found to be approximated by biexponential functions involving fast and slow components.
The decreasing tendency of radiocesium concentration in rivers was faster than that observed in the Chernobyl accident, and this is considered to have been due to the difference in environmental conditions [50]. Areas surrounding Chernobyl are dominated by fields and forests, whereas those surrounding the Fukushima NPP include urban and farmland (with paddies). Statistical analysis has implied that the decreasing tendency of radiocesium is related to the proportion of urban and farmland areas in the basin. In the Abukuma River drainage basin, 85% of the discharged radiocesium originated from the 38% of the region that is composed of farmland and urban areas, and the faster decline in radiocesium concentration in Fukushima is considered to have been due to the fact that radiocesium concentration in sediments discharged from urban and farmland area decreased rapidly [50].
Soon after the Fukushima accident, it was confirmed that the dissolved-radiocesium concentration in stream water and ground water was small enough compared to the drinking-water limit (10 Bq·kg−1) and decreased rapidly over time [53]. Also, the radiocesium concentration in air was found to be small enough not to cause significant inhalation dose to the public.
Although radiocesium movement in the environment generally is slow, it greatly changes depending on various environmental and artificial conditions. Therefore, detailed evaluation of radiocesium migration in real environments requires site-specific analysis considering the local environmental and other conditions.
3. Causes of air dose rate reduction and influencing factors
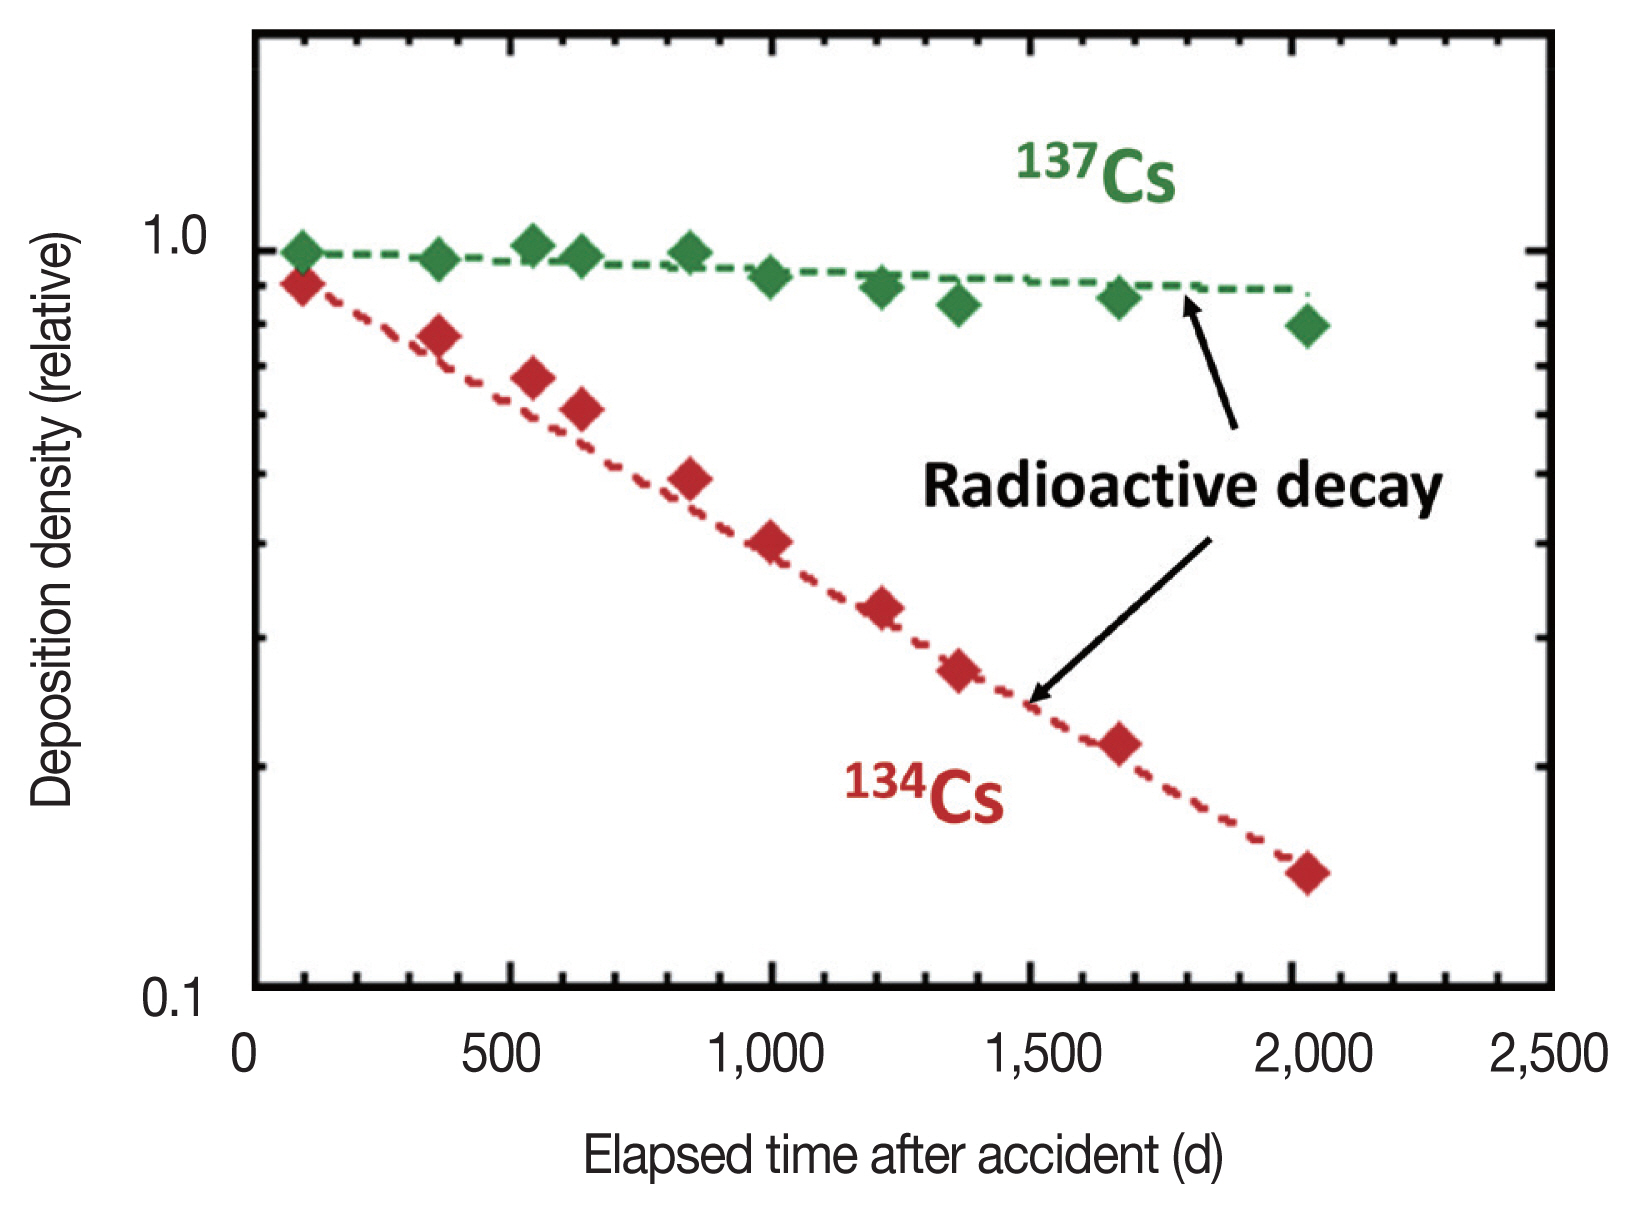
Three main causes for the decrease in air dose rate are: 1) radioactive decay of radiocesium according to the physical half-lifes; 2) vertical and horizontal migration of radiocesium; and 3) decontamination [34]. So far, the most important cause has been radioactive decay. The relatively short half-life of 134Cs (2.1 years) has contributed greatly to the air dose rate decrease; nevertheless, the contribution of 134Cs to air dose rate became smaller than that from 137Cs at 1,100 days after the accident, and the decreasing rate due to physical decay is slowing down (Figure 10) [34].

Temporal changes in air dose rates due to decrease in radiocesium deposition density shown in Fig. 8. Air dose rates were calculated by using dose conversion coefficients under assumption that depth profile of radiocesium did not change with time. Dashed lines indicate theoretical values due to radioactive decay [34].
Vertical (underground) penetration of radiocesium has increased shielding against gamma rays emitted from radiocesium, thereby reducing air dose rates. The penetration of radiocesium into the ground is not fast but it has increased the shielding effect steadily. In ground-contaminated environment, gamma rays in air come mostly from horizontal directions [54], and such gamma rays must penetrate a relatively large distance in the ground. That is why small radiocesium penetration contributes to increase in shielding effect obviously. The decrease in air dose rates due to the ground penetration until 2016 was estimated to about 25% in undisturbed flat fields [34].
The migration rate of radiocesium in horizontal directions is generally small, as already discussed, but in certain circumstances, such as urban areas and cultivated fields, horizontal migration is significant. This accelerated the decrease in air dose rate. The difference of decreasing tendency in air dose rate between fixed-location measurements and car-borne surveys (Figure 1) is considered to be due to differences in horizontal migration of radionuclides. In the early stage after the deposition, radiocesium deposited on artificial structures (such as paved roads and houses) was washed off within a short time, and this resulted in rapid air dose rate reduction. The radiocesium migration into horizontal directions was estimated to reduce air dose rates up to 30% on average till 2016 [34].
Decontamination was performed extensively over wide areas [55]. The dose reduction effect of locations where decontamination was performed has been examined, and reduction factors have been reported. Generally, reduction by a factor of more than two was observed in residential areas and farmland by measuring and comparing the air dose rates above decontaminated locations before and after decontamination [55]. However, the overall dose reduction effect in various environments where residents live is not easy to estimate. The average dose reduction effect by decontamination in the fixed-location measurements conducted at about 6,500 locations was estimated by comparing dose reduction tendency at the whole locations to that at locations where decontamination was not conducted. The average for the whole location was smaller than that for not decontaminated locations by ~20% in 2016 [34]. As the 6,500 locations were selected randomly, the difference may represent the general, averaged decontamination effect. More detailed analysis is necessary to evaluate actual decontamination effects in living environments.
In addition to the above mentioned three causes, a few factors have modified air dose reduction. One such factor is land use. A large amount of car-borne survey data have been analyzed statistically in connection with land use in several studies [12, 17, 35, 56, 57], which have confirmed that the air dose rate reduction differs significantly by land use. Reduction has reportedly been fast in urban areas, slow in forest, and medium in farmland, and these differences also are to be expected from comparisons of radionuclide migration in different environments.
There is evidence that air dose rate reduction is accelerated by human activities. The car-borne survey data indicated apparently different decreasing tendencies between areas outside and inside the evacuation zone [17, 35, 56, 57]. Even in the evacuation zone, tendencies differ according to the restriction level [35]. Shortly before the evacuation order was lifted, when human activities were revitalized to arrange the circumstances for returning residents, reduction in air dose rate in this area was accelerated. Outside the evacuation area, the air dose rate indicated rapid decrease from the beginning even though large-scale decontamination had not yet been started. Research concerning migration by rivers implied that a large portion of radiocesium discharge originated from environments related to human living [50]. These suggest that general human activities, not only decontamination, tend to accelerate dose rate reduction.
Seasonal dependence is also a factor in air dose rate reduction; air dose rates decrease faster than physical decay especially during summertime starting in June [24]. The reason is not very clear, but bioturbation [58] could promote the penetration of radiocesium into the ground in this season when activities of biota are most frequent. To check this hypothesis, more detailed investigation is needed.
4. Ecological half-life and prediction model
The trend of air dose rates after radionuclide deposition, excluding the reduction by physical decay, has often been modeled by a biexponential function expressing fast- and slow-decay components [59]. After the Fukushima accident, the empirical biexponential model was applied to the car-borne survey [17, 35, 56, 57] and other data [11, 36, 60]. The ecological half-life of the fast-decay component was determined to be less than one year in several studies. The analysis of recent survey data has indicated that there is a decay component with an ecological half-life of several years. Ecological half-lives were found to differ according to land use and evacuation order which may be due to the prior-discussed reasons concerning human activities. As new survey data are accumulated, the analysis of ecological half-lives will be better defined and thus should continue to be explored.
A prediction model of air dose rates for the Fukushima environment was developed on the basis of statistical analysis of car-borne survey data assuming a biexponential model [17, 57]. A large amount of car-borne survey data was classified by land use and evacuation order rank and analyzed, which provided the most appropriate parameters and their distribution for each class. Kinase et al. used a rather simple empirical model, but the statistical analysis of a large amount of car-borne survey data made it possible to predict air dose rate distribution realistically with confidence intervals. Instead of conventional bi-exponential models, some new models can be applied to approximate the air dose trend, which may give more realistic insight into the air dose rate reduction [61].
Extended studies of environmental monitoring
1. Integration of different monitoring results
(1) Air dose rate
A sophisticated method using Bayesian statistics has been developed to integrate air dose rate maps created by different monitoring methods [18]. In this method, results of helicopter, car-borne, and walk surveys are integrated while keeping the specific features of each monitoring method (Figure 11). The intent of the integration is to create a map such as would be obtained if walk surveys were conducted over the whole targeted area. The developed method was first tested for Fukushima city [18], and the the targeted area was extended to the entire evacuation zone [60], and finally to the 80 km zone [45]. In the integration, the correlation between two different monitoring methods and the self-correlation of walk survey data were analyzed and used. Generally, values in the helicopter-survey data were found to be slightly higher than those observed on ground. By integration, helicopter-survey results were adjusted lower by relation with walk survey data, while the fine details of air dose distribution in walk and car-borne surveys were reflected in the integrated map. Currently, integration maps using past Fukushima accident data are being constructed.

Applying Bayesian statistics to integrate three kinds of survey results with different specific features. (A) Walk survey. (B) Car-borne survey. (C) Helicopter survey. (D) Integrated map.
(2) Deposition density of radiocesium
In order to construct an initial deposition-density map of radiocesium covering wide regions in eastern Japan, the data from helicopter surveys conducted in different periods were compared and integrated [28]. The results of the third helicopter survey performed in May–July 2011 were already calibrated to the results of the soil sampling performed in the Fukushima mapping project. However, the data of the third helicopter survey were limited to the 80 km zone, whereas the fifth helicopter survey performed in June 2012 covered most of eastern Japan. Then, the third and fifth helicopter survey data were integrated after decay correction for the influence of multiple factors including the physical decay, natural weathering processes, variation in the calibration procedure, and other defined mechanisms between two helicopter surveys [28]. By summing up the data shown in the integrated deposition-density map (Figure 12) [28], the total 137Cs deposition in the eastern Japan was estimated to have been 2.48 PBq. This total deposition of 137Cs is close to the value to the value of 2.0 PBq obtained by Saito et al. [27] by a simple integration of the fifth helicopter-survey data with in situ spectrometry data. Meanwhile, Msoudi et al. analyzed statistically the spatial structures of soil sampling data and helicopter-survey data, and indicated that the structures are in agreement in large-dimension rather than in small-dimension [62].
2. Identification of origin of deposited radionuclides
The ratio of deposition densities between two different radionuclides contains information on their origin—which reactor was the main contributor to an arbitrary area’s contamination. In particular, the ratio of 134Cs to 137Cs is an effective indicator of origin, because the chemical behavior is considered to be the same between the isotopes and the released-radionuclide ratio is maintained in the deposition density ratio. Reactor analysis results indicated that the 134Cs:137Cs release ratios were 0.94, 1.08, and 1.05 for reactors 1, 2, and 3, respectively, as of March 15, 2011 [63, 64].
A map of 134Cs:137Cs deposition-density ratios over a wide area in eastern Japan indicated regional variation [23], which was analyzed by atmospheric dispersion simulation and using information from reactor analysis [63]. The regional distribution of deposition density ratio obtained from the model simulation showed general agreement with that observed. The analysis facilitated estimation of the dominant reactors for each region’s contamination and for different periods’ release during the accident. Also, a long, narrow north-northwest-trending area with low ratios was identified in the vicinity of the NPP site and was thought to have been contaminated by a plume from reactor 1 [63, 65].
3. Practical protocols for sampling and monitoring
Large-scale environmental monitoring has provided valuable opportunities for studies that are of practical importance. A soil-sampling protocol in emergency situations on the basis of the large-scale soil sampling after the Fukushima accident was proposed by Onda et al. [66]. In a severe nuclear accident when wide areas are contaminated, great number of soil samples need to be collected in a short time to assess the contamination conditions over wide areas. Therefore, the number of soil samples to collect at any one location should not be large; the sampling procedure should be simple while keeping the associated uncertainties sufficiently low. After analysis of preliminary sampling results, it was determined that five soil samples within a 3×3 m2 area is the minimum number required for reducing measurement uncertainty in emergency soil sampling. Separate soil-sampling protocols were developed for hard- and soft-surface soils. Also, it was found that sufficient mixing of collected samples is critical for accurate measurements of radioactivity in the samples. Thus, a concrete-mixing method was determined and described in the protocol. The protocol was cited in IAEA’s guidelines on soil and vegetation sampling [67].
In the in situ spectrometry continuously performed in the mapping project, intercomparisons among the participating groups were conducted for every campaign to check measurement uncertainties. Based on 5 years of such intercomparisons, two different intercomparison protocols were suggested: 1) simultaneous measurements in a narrow area within a 3 m radius; and 2) sequential measurements at an identical point [68]. The first method can be used when an appropriate site is found where the contamination is rather homogeneous and the radiation level does not change significantly within the range of several meters. The intercomparison finishes in relatively short time when the first method is applicable. When an appropriate site is not found for using the first method, the second method is applied. Although it takes more time, no significant difference from the first method was observed in terms of associated uncertainties.
External exposure dose evaluation for residents
In the Fukushima accident, external exposures contributed mostly to the long-term public-exposure doses, because the restriction of contaminated foods was started in the early stage of the accident, and it was seldom possible for residents to ingest significant amount of radionuclides. External exposure doses are discussed briefly in this section, focusing on the relation with environmental monitoring data.
1. Evaluation based on simple assumptions
In the early phase of the accident, external exposure doses of the public were often evaluated on the basis of simple assumptions from air dose rates measured by helicopter surveys. It was assumed that ambient dose equivalent is equal to effective dose equivalent, and a resident spends 8 hours outdoors and 16 hours indoors. This resulted in significant overestimates of exposure doses [69] leading to not-always-optimal decision-making on measures for radiation protection or remediation.
There are several factors involved in the overestimation. First, in general, helicopter-survey data obtained after the Fukushima accident tended to be somewhat higher than those obtained on the ground, as described earlier. Second, the air dose rates differed depending on the location even in a small area. Helicopter surveys cannot recognize the local variation of air dose rates, and in most cases people live at locations with relatively low radiation levels for the area. Third, the dose conversion coefficients from ambient dose equivalent to effective dose for radiocesium distributed in the ground have been reported to be about 0.6 [70–72]; therefore, it is too conservative to assume that effective dose equivalent can be approximated by ambient dose equivalent. Forth, the time residents spend outdoors is obviously shorter than 8 hours [73, 74]. These factors led to the overestimation.
More realistic dose estimations were tried in many cases. An important example of realistic dose estimations is that for residents in Fukushima Prefecture during four months after the accident conducted as a part of the Fukushima Health Management Survey [75]. Also, large-scale individual monitoring for residents was performed by many municipalities, which provided invaluable information on exposure doses of residents. Details of these subjects should be cited elsewhere. In the next section, we will introduce a trial to estimate external doses for returning evacuees.
2. Evaluation for residents returning to evacuation zone
Dose measurements using a personal dosimeter were widely used, but the method is hard to apply in the case where evacuated residents are planning to return to their homes after the future lifting of the evacuation order. For dealing with such cases, a new trial was devised to evaluate realistic external doses based on air dose measurements along personal routes representing patterns of movement in their daily life [73]. In FY 2014–2016, the dose evaluation was performed for 196 residents expected to return to six towns and villages in Fukushima. First, each resident was interviewed concerning expected life patterns (including concrete living locations and times after returning to their homes), and then, along the personal routes, air dose rates were measured with a KURTAMA-II system in detail. Next, the air dose rates along the personal routes were integrated taking the time spent at each location into account to estimate expected external doses. The distribution of evaluated doses is shown in Figure 13 for three different ranks of evacuation order [73]. The maximum annual additional effective dose among the 196 objects was estimated at 4.9 mSv, and the average dose, at 0.86 mSv. For 93% of all residents, the evaluated annual additional doses were less than 2 mSv.
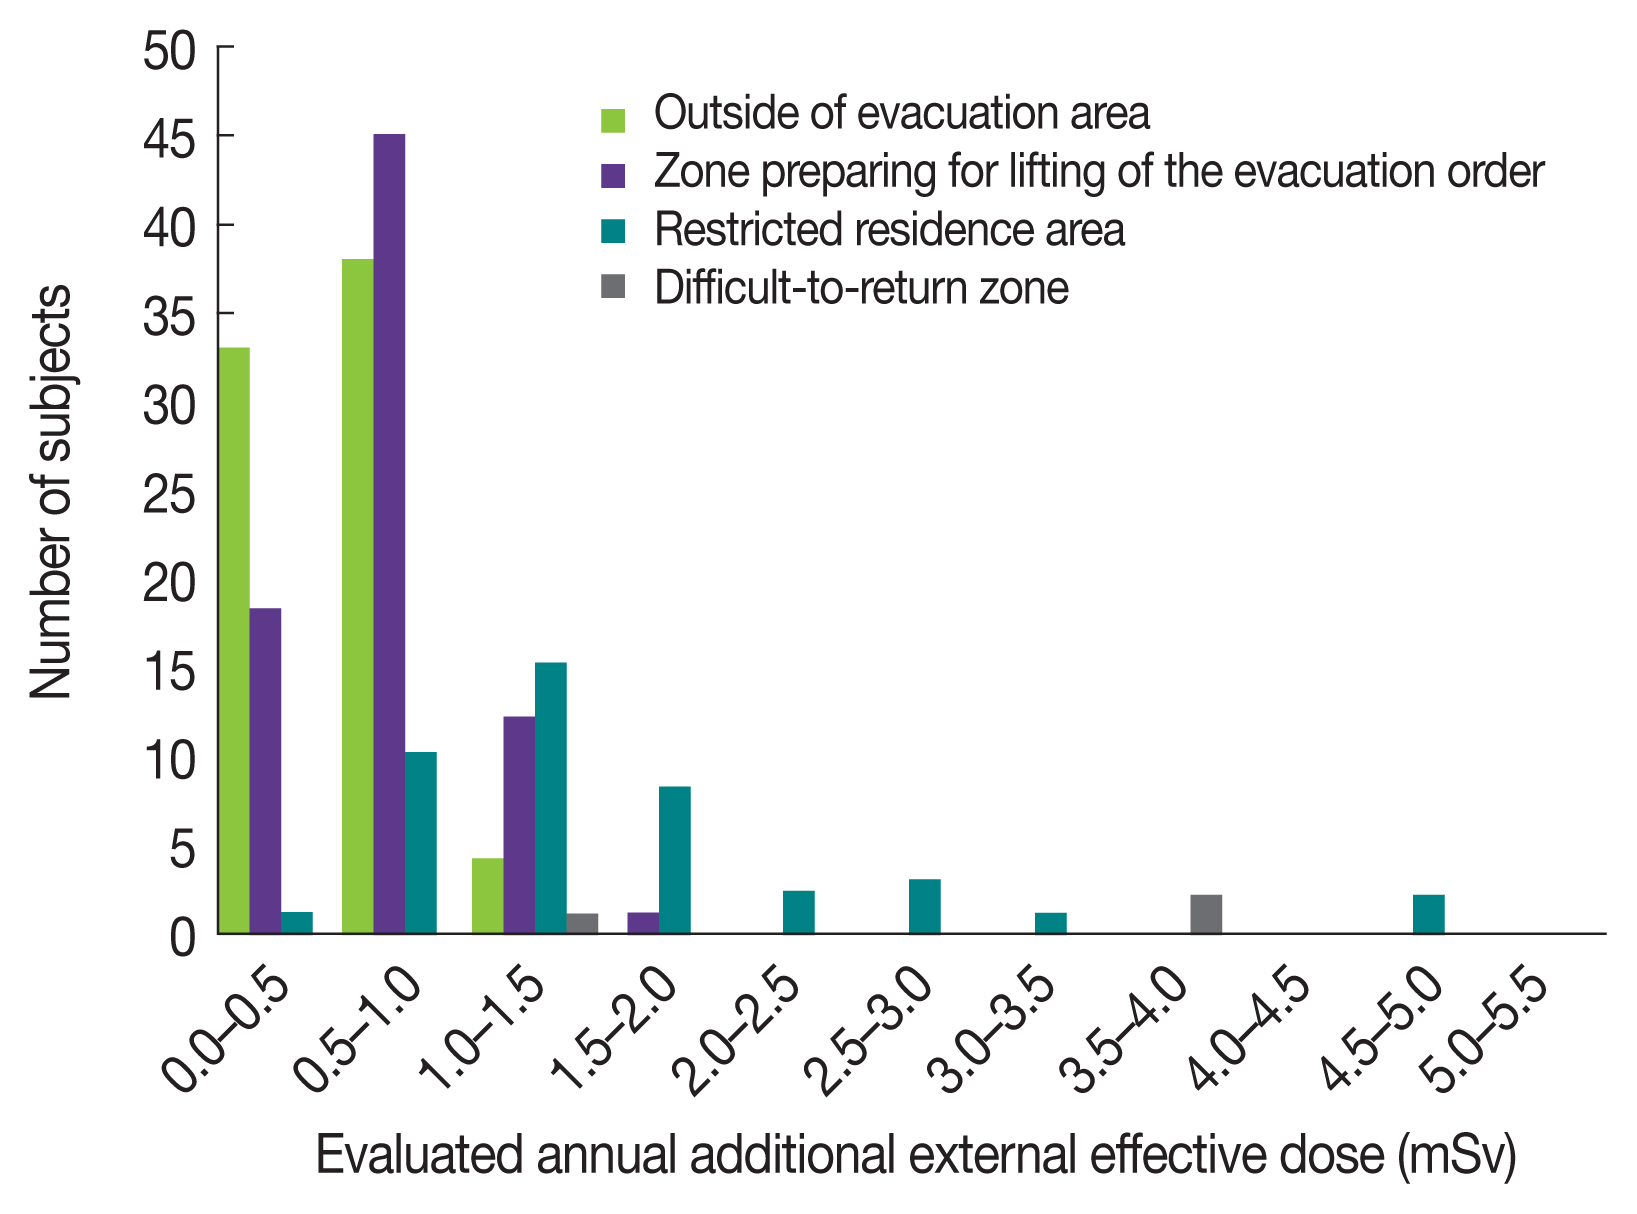
Evacuation orders have been lifted for the areas in which the annual additional doses of residents were inferred to be <20 mSv. The annual exposure doses of returning residents are expected to be much smaller than 20 mSv and well within a few millisieverts. Also, the average time spent indoors was calculated to be 87% of the total living time according to the statistics from the interviews, which is much longer than that assumed in the current rough estimations. About 66% of the annual exposure dose was due to exposures at home. Thus, it was confirmed that accurate information on indoor radiation levels is essential from the viewpoint of accurate exposure dose evaluation.
3. Dose reduction factor by house
The dose reduction factor, defined as the air dose rate ratio between inside and outside a house, is essential information to evaluate exposure doses based on outdoor air dose rates. The dose reduction factor is often called the shielding factor, protection factor, or location factor; however, the basic concept is common among these factors. After the Fukushima accident, a value of 0.4 has been widely used as the dose reduction factor according to the IAEA [76]. Several studies on the dose reduction factor have been performed in Fukushima, and the characteristics of the factor for Japanese houses have been made clear [77–80]. It was found by simulation that the dose reduction effect by Japanese houses with lightweight construction can be explained mostly by the area under a house that is uncontaminated by radionuclides [78]. The uncontaminated effect was confirmed also for a group of houses by simulation [81]. Figure 14 shows the frequency distribution of dose reduction factors for wooden houses in Fukushima in areas before decontamination and in areas after decontamination [79]. In highly contaminated areas, the value of 0.4 was found to approximate the dose reduction for typical Japanese houses on average; however, the factor tends to become higher when air dose rates become low because the dose reduction for background gamma rays is different from that for radiocesium. In any case, the dose reduction factor varies largely according to local conditions; the main reason of the variation is considered to be that the air dose rate could fluctuate greatly according to location, especially in a contaminated area, and it is not easy to select representative locations to calculated the dose reduction factor. Therefore, in view of these limitation, the reduction factor should be used carefully.
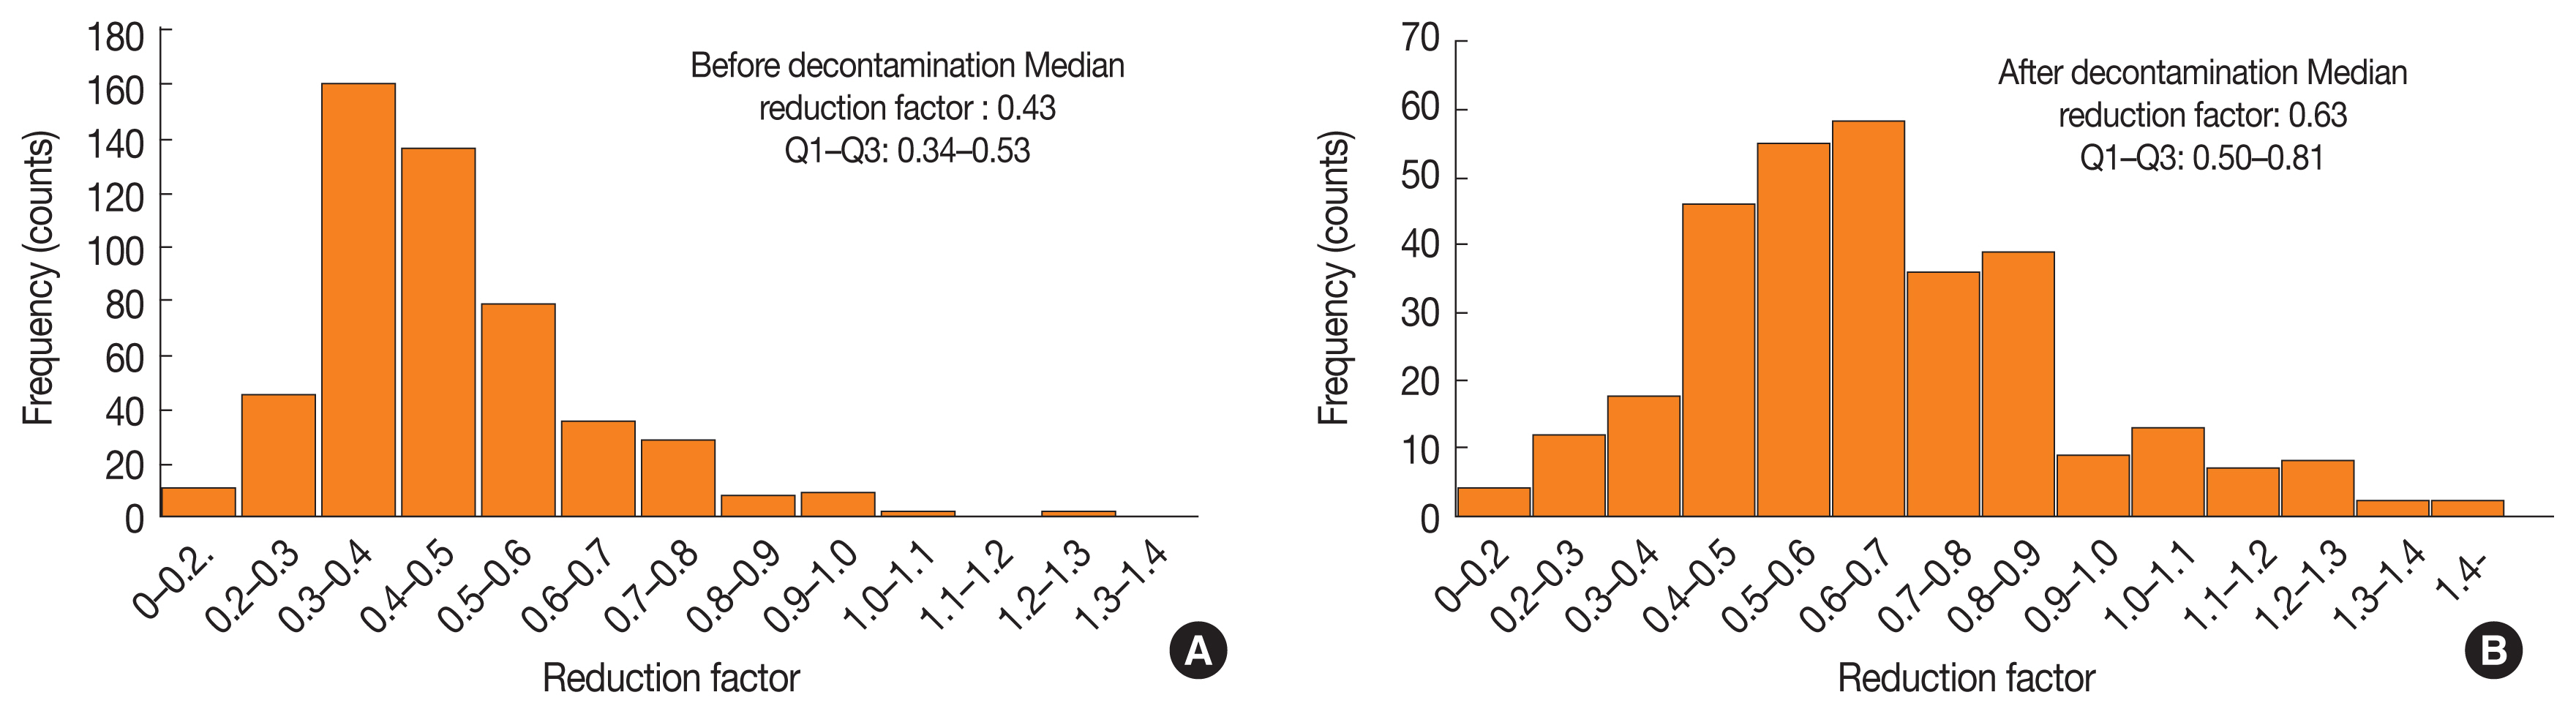
Frequency distribution of dose reduction factor for (A) 69 detached wooden houses in Iitate Village (59 houses) and Odaka district (10 houses) before decontamination work started in 2012 and 2013 and (B) 37 out of 59 houses in Iitate Village after decontamination work was completed in 2014 [79].
Preservation and provision of environmental data, information and samples
Large amount of new environmental data and related knowledge have been accumulated and should be stored in robust and secure manner, and provided to diverse users from the public to scientists via appropriate means. First, the accumulated monitoring data in the Fukushima mapping project and aerial monitoring project have been published as distribution maps of air dose rates and deposition densities in the extension map site run by the Japan Nuclear Regulation Agency [82, 83]. The agency is also publishing the numerical data from different kinds of monitoring obtained around the Fukushima site through their homepage [84]. The Japan Atomic Energy Agency (JAEA) operates a versatile database of compiled monitoring data obtained by ministries, agencies, and local municipalities [83, 85, 86]. The database consists of environmental data of which quality is assured, and the data is in standardized formats and also presented in several different ways according to users’ needs.
In addition to keeping the formal monitoring data obtained by official organizations, it is also essential to gather and store unofficial information on radiation environments obtained by various organizations and individuals—data that might be lost over time if not collected intentionally. A task group of the Science Council of Japan has worked on collecting such information and launched a database assembling metadata of the information [87]. Basically, they do not intend to keep the data, just the metadata to indicate where the data are preserved.
Not only numerical data but also accumulated knowledge after the accident needs to be summarized and provided for a wide range of audiences. In particular, information such as radiological conditions, exposure doses, and health effects from the Fukushima accident should be disseminated in simple terms. The JAEA constructed a website to provide compiled research results in Q&A format for a variety of users from the public to research scientists [88, 89]. Ordinary people can learn the major points of research results written in simple language, and scientists can obtain more detailed information on scientific documents according to need such as scientific reports, review documents, and academic papers.
Environmental samples collected in the early phase could have important information on deposited radionuclides as well as their physical or chemical conditions. Among various environmental samples, soil samples are considered essential since soil is a basic medium for holding a large proportion of the radionuclides in terrestrial environments. Soil samples collected in the mapping project have been stored under good conditions for future use with metadata such as collected place and time, radionuclide concentration, history of analysis, etc. Some of the soil samples have already been used for several purposes. For example, 129I measurements using accelerator mass spectrometry to estimate the initial 131I were carried out on several hundred soil samples from the stored soil samples.
Summary and future challenges
The temporal change in radiological environments around the Fukushima NPP site has been investigated continuously at a large scale since the accident. Investigation have clarified that the radiation levels in Fukushima have decreased significantly after 8 years, especially in various environments related to human living. The main causes of the air dose rate reduction were considered to be radioactive decay, incremental shielding effect with penetration of radiocesium into the ground, horizontal migration of radiocesium, and decontamination. The decreasing tendency was found to be modified by land uses and human activities. An overall picture of radiocesium migration in the Fukushima environment became possible from extensive migration studies, and the temporal change in radiation levels can be explained qualitatively by movement of radiocesium in the environment. A prediction model for air dose rates was developed by applying an empirical biexponential formula, and analyzing big data obtained from car-borne surveys enabled the determination of appropriate parameters for classified situations and the prediction of air dose rate distribution with confidence intervals. An important future challenge is to explain the temporal change quantitatively by radiocesium movement. This effort has already been started; investigations at different levels, from small to large scales, are required. The complete explanation will facilitate the prediction of radiation level based on radiocesium migration, which could be applied flexibly to various emergency situations.
Integration of the large amount of accumulated environmental data and knowledge is critical and will lead to producing new data with better quality and reliability or further knowledge. Some kinds of integration have been initiated; compilation of air dose rate data and ground deposition data have resulted in more comprehensive and reliable maps. Moreover, integration of different kinds of data may provide unique information. For example, great number of individual doses measured with personal dosimeters may yield different insights into the composition of exposure doses through integration and analysis with comprehensive air dose rate data. Interpolation and extrapolation of radiological data through time is also important subject. By combining spatial integration and the temporal interpolation and extrapolation, spatiotemporal air dose rate maps will be completed, which will be useful in various ways.
Obviously, one of the most important applications of accumulated radiological environmental data is exposure dose evaluations. Since the Fukushima accident, various trials for evaluating exposure doses of residents have been performed using different methods from simple to sophisticated. In any event, accurate data on radiological environments facilitate improvement of dose evaluation accuracy. Exposure dose evaluations need to cover the whole periods after an accident: past, present, and future. Accordingly, accurate spatiotemporally integrated data on the radiological environment are becoming more important. Because it will take a long time to complete lifting the whole evacuation orders in Fukushima, realistic dose evaluations based on accurate radiological environmental data are critical for making optimal decisions to lift the evacuation orders.
Another essential issue is to compile knowledge and experiences from the viewpoint of radiation protection for the future. In the early phase of the accident, we suffered from extreme shortage of environmental monitoring data because of damages to the monitoring facilities due to the earthquake and tsunami, which resulted in significant uncertainties in exposure dose evaluation for the public. Great efforts to reduce the uncertainties have been made afterwards, especially in dose reconstruction for 131I. After a period of time, several large-scale ongoing environmental monitoring projects were launched that have led to the accumulation of large amount of environmental data. The data have been used for evaluation of accident consequences and for radiation protection and remediation. Thanks to recent progress in radiation-measurement technology, we have obtained substantial amount of environmental data that were not comparably accumulated in the past accidents. Even individual monitoring with personal dosimeters was demonstrated to be feasible at a large scale and has provided useful information on exposure dose distribution based on direct measurements rather than on model calculation. It is necessary to totally evaluate these monitoring activities and the obtained data to establish procedures for optimal environmental monitoring and radiation protection in emergency and existing exposure situations for future emergencies.
Acknowledgment
We would like to express our hearty thanks to the editors of the journal for giving us a chance to write this invited article. Most of the monitoring results introduced in this paper were obtained in the projects funded by the Ministry of Education, Culture, Sports, Science and Technology (MEXT) or the Nuclear Regulation Agency (NRA).