Study on Dual-Energy Signal and Noise of Double-Exposure X-Ray Imaging for High Conspicuity
Article information
Abstract
Background
Dual-energy X-ray images (DEI) can distinguish or improve materials of interest in a two-dimensional radiographic image, by combining two images obtained from separate low and high energies. The concepts of DEI performance describing the performance of double-exposure DEI systems in the Fourier domain been previously introduced, however, the performance of double-exposure DEI itself in terms of various parameters, has not been reported.
Materials and Methods
To investigate the DEI performance, signal-difference-to-noise ratio, modulation transfer function, noise power spectrum, and noise equivalent quanta were used. Low- and high-energy were 60 and 130 kVp with 0.01–0.09 mGy, respectively. The energy-separation filter material and its thicknesses were tin (Sn) and 0.0–1.0 mm, respectively. Noise-reduction (NR) filtering used the Gaussian-filter NR, median-filter NR, and anti-correlated NR.
Results and Discussion
DEI performance was affected by Sn-filter thickness, weighting factor, and dose allocation. All NR filtering successfully reduced noise, when compared with the dual-energy (DE) images without any NR filtering.
Conclusion
The results indicated the significance of investigating, and evaluating suitable DEI performance, for DE images in chest radiography applications. Additionally, all the NR filtering methods were effective at reducing noise in the resultant DE images.
Introduction
Dual-energy X-ray imaging (DEI) can differentiate, or enhance material content (e.g., bone or soft tissue), in a two-dimensional radiograph, by combining images obtained at separate low and high energies [1]. A commercial DEI system uses the fast kilovoltage (kV) switching technique (also known as the double-shot or double-exposure technique), which acquires low- and high-energy projections in successive X-ray exposures. Although it can provide improved visualization of lesions, its overall clinical receiver operating characteristic performance at a dose equivalent to that of conventional digital radiography, is similar to that of digital radiography [2]. For the reliable and better use of the double-exposure DEI system for specific imaging applications, the double-exposure DEI system should be optimally designed with a proper selection of dose allocation, energy combination, and energy-separation filter material and thickness.
Richard [3] provided a valuable guide for the optimization of a clinical prototype for high-performance dual-energy (DE) chest imaging, Bowman et al. [4] evaluated the feasibility of DEI techniques, and optimized parameters of the ExacTrac stereoscopic imaging system, to enhance soft-tissue imaging for application to lung stereotactic body radiation therapy. Jeon et al. [5] investigated the image quality of virtual monochromatic images synthesized from DE computed tomography, and found that the DE scan mode with the 100/140 kV protocol achieved a better maximum contrast-to-noise ratio (CNR), compared to the 80/140 kV protocol for various materials, except for adipose and brain. We noted that a basis material-decomposition using a calibration phantom had been applied for DE radiography [6].
The DE performance-assessment study was introduced by Richard and Siewerdsen [7] using Fourier metrics, such as the modulation transfer function (MTF), Wiener noise power spectrum (NPS), and detective quantum efficiency (DQE). Unlike traditional Fourier domain analysis methods, we performed weighted-logarithmic operations using MTF, NPS, and DQE, acquired at low or high energies. Describing the performance of a double-exposure DEI system using the concepts of DE MTF, NPS, and DQE, have already been introduced. However, the performance evaluation of double-exposure DEI with respect to various technique parameters has not been reported. We presented the measured results of DE MTF and NPS of the double-exposure DEI system including the noise-equivalent quanta (NEQ) since the number of DE photons is define as [7]:
However, this description is ambiguous. Furthermore, their properties for various operational parameters were investigated.
Additionally, noise in the X-ray detector could be reduced by increasing the dose level, but this should be avoided because quantum noise is proportional to the square of the number of photons. In this study, we conducted a pilot study to investigate the effectiveness of well-known digital filtering methods, for noise reduction (NR) in the DE reconstruction of images obtained from the large-area flat-panel detector. The NR filters included Gaussian NR (GNR), median NR (MNR), and anti-correlated NR (ACNR). Their effects on the reconstructed DE images were investigated in terms of the relative signal-difference-to-noise ratio (SDNR). We briefly discussed on the imaging performance, including the SDNR, MTF, NPS, and NEQ, of the various NR filters.
Materials and Methods
1. Dual-Energy X-ray Imaging
The signal, S, of a detector image could be expressed in terms of the incident X-ray fluence,
As shown in Fig. 1, the DE image acquired a pair of low-energy (LE) and high-energy (HE) images from the single-layer detector at double exposure [8]. Then, a DE image was obtained by weighted subtraction of a logarithmic HE image, expressed as follows:
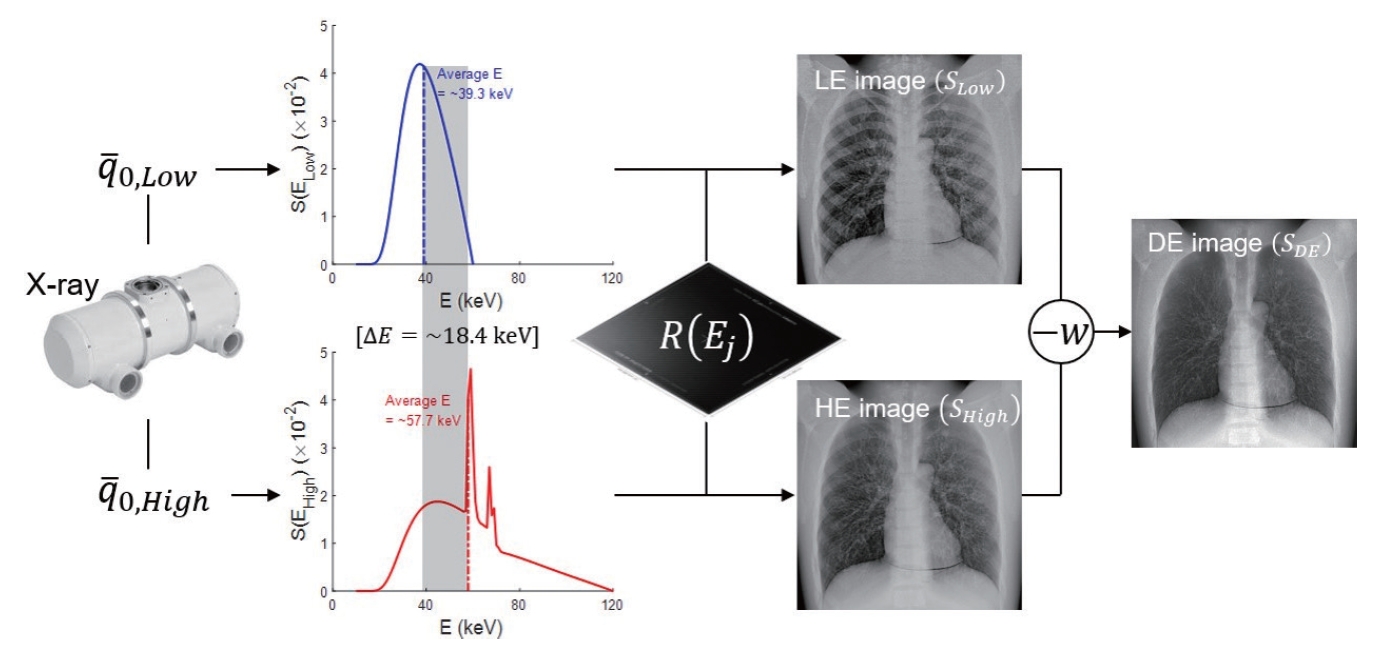
Schematic illustration of dual-energy (DE) X-ray imaging technique. We use an in-house MATLAB routine that implements algorithms published by Tucker et al. [8] for tungsten-target X-ray spectrum generation. In scheme, q0, S(Ej), and R(Ej) are incident photons, X-ray spectrum, and detector response at the specific X-ray energy, respectively. LE, low-energy; HE, high-energy.
from a logarithmic LE image, expressed as follows:
where μj imply the linear-attenuation coefficient of the specific material, wf is the weighting factor for suppression of the non-interest tissue in DE image, and wf for bone suppression is defined as follows:
The doses delivered to the patient by LE and HE are 0.01 to 0.09 mGy, respectively, and the total doses are 0.1 mGy. Therefore, the dose allocation (ξ, values between 0 and 1) is defined as:
2. Noise Reduction
The noise in the DE resultant images was increased by the weighted-logarithmic subtraction operation and therefore, we applied three NR filters.
1) Gaussian filter
A Gaussian filter was applied with a Gaussian distribution to a HE image, which is often used to reduce the noise generated by a normal, or probability distribution. The GNR is expressed as follows [7]:
where fG defined as,
which implies the kernel size of the filter and σG denotes the standard deviation of the Gaussian function. The kernel size for the GNR was 7×7.
2) Median filter
To reduce noise from a HE image, the median filter of nonlinear filtering was used, and an MNR with a 7×7 kernel size is expressed as follows [9]:
3) Anti-correlated filter
We applied the ACNR defined in several studies [10–12]. The ACNR filter exploits the anti-correlation of quantum noise in soft-tissue and bone images. This effectively reduces the non-interest anatomical structure from the DE image, which leaves some quantum noise, and residual edge artifacts. The ACNR for the DE soft-tissue image is expressed as follows:
where
3. Measurements and Assessments
To investigate the DE signal and noise performance, X-ray images between the air (no object), and the anthropomorphic chest phantom (LUNGMAN; Kyoto Kagaku Co., Kyoto, Japan) inserted with an artificial nodule (+100 Hounsfield unit [HU]) were acquired for imaging technique parameters. LE and HE of 60 kVp and 130 kVp, respectively were used to maximize energy-separation (i.e., to reduce quantum noise). The energy-separation filter material, and its thicknesses were tin (Sn), and 0.0 to 1.0 mm, respectively. And K-edge energy of the Sn filters was approximately 30 keV, which reduced the ratio of spectra corresponding to HE while using 60 kVp of LE and reduces the ratio of spectra corresponding to relatively LE while using 130 kVp of HE. An X-ray imaging detector (Xmaru 1717SGCTM; Rayence Co., Hwaseong, Korea) was placed at a distance of 1,800 mm from the X-ray tube (REX-650R; Listem Co., Wonju, Korea).
For the quantitative assessment of image quality in the space domain, we calculated the SDNR of the enhanced tissue, j, against the background, bgn, which was normalized by the ξ, such that:
where d and σ are the average signal, and standard deviation of the regions-of-interest (ROIs), respectively.
The DE MTF model for DE images was previously introduced [14], and then the formula of the model is given by:
where MTFj is defined as:
and FT indicates the Fourier transformation, and ESFj denotes the presampled data of images obtained from the edge-knife phantom [15, 16].
Richard and Siewerdsen [7] derived the DE normalized NPS (NNPS) of the DE images,
The DE NPS is given by the squared weighting-summation of the NPS of the LE, and NPS of the HE. NPSj is defined as:
and ∆I indicates the zero-mean noise image, and ∆f denotes frequency binning [17].
The NEQ describes the SNR of the output image and defined as [7, 18]:
Finally, we applied NEQ to the DE images as follows:
Results and Discussion
Fig. 2 shows the comparison of the anthropomorphic chest phantom, artificial nodule DE images reconstructed with various NR filters, and Sn-filter thickness (tSn). All the NR filtering successfully reduced noise compared to the DE images without NR filtering, as shown in the upper-left part of Fig. 2. Quantitatively examing the DE images of Fig. 2, the GNR and MNR showed more edge-enhanced textures than the ACNR, because of the Gaussian blurring and median filtering (that is, the average effect of the edge of the HE image), respectively. This edge enhancement improved the visibility of details with high spatial-frequency contents, and played the role of boundary artifacts, as shown by the white arrow in Fig. 2. Additionally, this effect was observed in sandwich detectors for single-exposure DEI techniques using scintillators of different thicknesses [14].
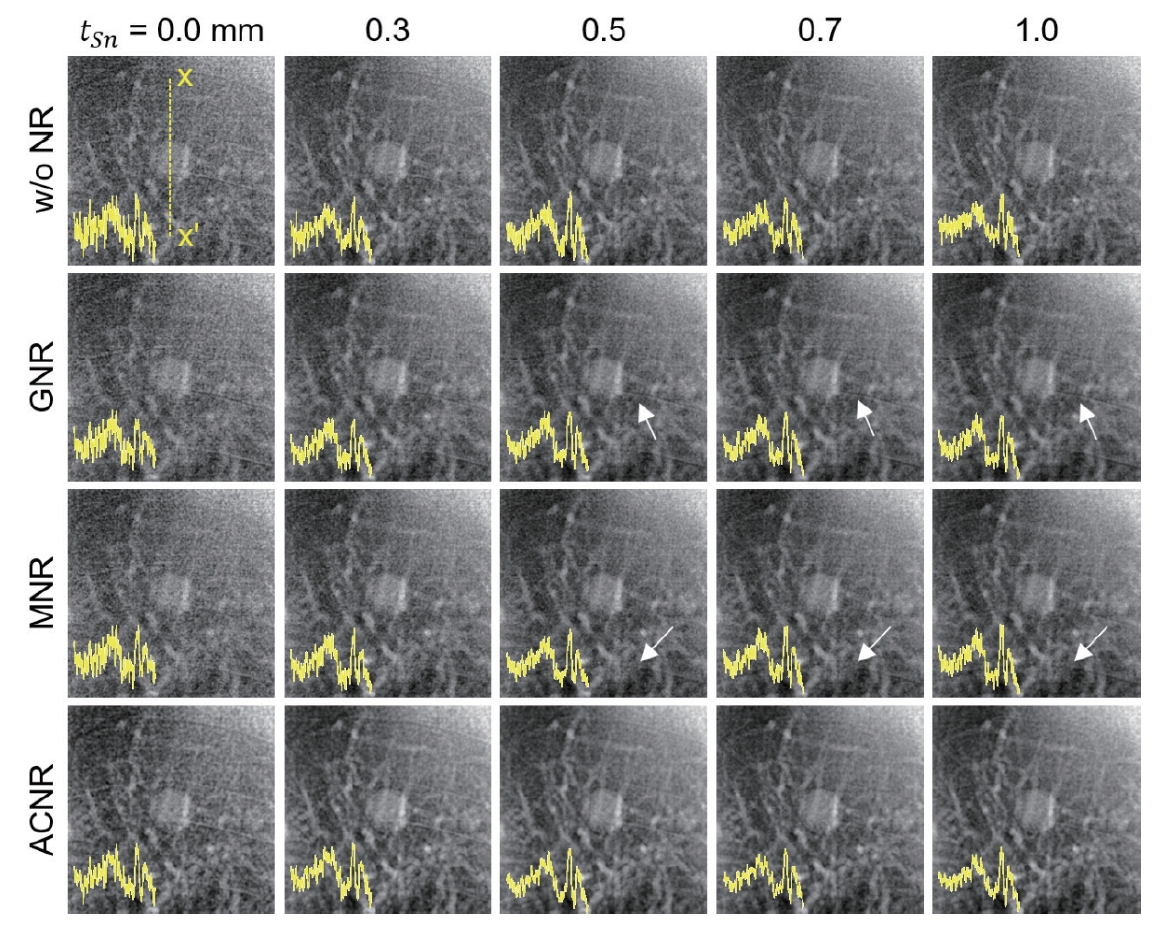
Comparison of dual-energy artificial-nodule-enhanced images and one-dimension profiles with three noise reduction (NR) filtering and Sn-filter thickness (tSn) at 60/130 kVp and dose allocation (ξ)=0.3. ACNR, anti-correlated noise reduction; GNR, Gaussian noise reduction; MNR, median noise reduction.
We required constraints for optimization of the NR parameter, and faced difficulty in optimizing kernel size, because the degree of noise reduction is proportional to the filter kernel-size according to the filtering method. Therefore, heuristically acquired filter parameters, such as Richard and Siewerdsen [19] may be required.
Fig. 3 shows the comparison of DE images of various NR filters and ξ of artificial nodule images obtained for an anthropomorphic chest phantom. Although all NR filtering reduced the DE image noise, the effect of the NR was negligible when ξ was 0.1. The reconstructed DE image in GNR and MNR showed edge enhancement due to the weighted-logarithmic subtraction with the non-blurred LE image, because the HE image was blurred by filtering.

Comparison of dual-energy artificial-nodule-enhanced images and one-dimension profiles with three noise reduction (NR) filtering and dose allocation (ξ) at 60/130 kVp and Sn-filter thickness (tSn)=0.5. ACNR, anti-correlated noise reduction; GNR, Gaussian noise reduction; MNR, median noise reduction.
Fig. 4 shows signal difference (SD), noise, and SDNR calculated from the artificial-nodule-enhanced DE images for various combinations of tSn and ξ. The effects of tSn and ξ on SD performance were nearly negligible, as shown in Fig. 4A and 4B. Hence, NR filtering maintained the SD value almost constant. As shown in Fig. 3C, the ACNR showed a better noise performance of artificial-nodule-enhanced DE images than the MNR and GNR as a function of the tSn . However, the noise performance of ACNR was superior when ξ was less than 0.3, while the noise performance of MNR and GNR was superior with the fine difference, when ξ was greater than 0.4, as shown in Fig. 4D. A larger energy separation between the two energies with tSn enhanced the SDNR, and the performances of GNR and MNR had similar performance with increasing tSn . The SDNR performance of the ACNR increased the most for tSn, as shown in Fig. 4E. The results are similar to those reported by Warp and Dobbins [13], who demonstrated a reduction in the noise component at various spatial frequencies for these, and other noise reduction algorithms. The highest ACNR performance result supports the results of reducing the size of random noise, such as yellow profiles in columns 1 and 4 of Figs. 2 and 3, respectively. Fig. 4F shows the SDNR performance for ξ used in DE reconstruction. Without NR filtering, ξ=0.3 represented the optimal ξ. All the NR filtering suppressed image noise, and improved SDNR performance. Particularly, reflecting the results of Fig. 4D, the SDNR performance of ACNR was superior when ξ was less than 0.3, whereas the SDNR performance of MNR and GNR was superior when ξ was greater than 0.4.

(A, B) SD, (C, D) noise, and (E, F) SDNR measured from the dual-energy artificial-nodule-enhanced image as functions of Sn-filter thickness (tSn) and dose allocation (ξ). SD, signal difference; SDNR, signal-difference-to-noise ratio; NR, noise reduction; ACNR, anti-correlated noise reduction; GNR, Gaussian noise reduction; MNR, median noise reduction.
Fig. 5 shows the DE MTF results. The DE MTF was largely dependent on wf used for reconstruction as shown in Fig. 5A. As wf increased, the DE MTF was decreased. From DE MTF analysis with increasing the tSn in Fig. 5B, DE MTF degraded by increasing Sn-filter thickness could be affected by scatter X-rays and characteristic X-rays. Therefore, it is important to analyze the X-ray interaction through Monte Carlo N-particles (MCNP) simulations (e.g., particle-tracking tally). As shown in Fig. 5C, the DE MTF was nearly independent of ξ, except for ξ=0.1. All NR filtering decreased the DE MTF, the GNR filtering showed boost-up characteristics at the spatial frequencies 1.3 mm-1 because of Gaussian filtering of the HE image. Hence, these characteristics resulted from the subtraction of two MTFs having different spatial-resolution characteristics, and HE images were filtered by GNR, which reduces noise but degrades spatial resolution. The ACNR filtering showed higher DE MTF performance, with respect to the other NR filtering at the spatial frequencies above 2.3 mm-1 (i.e., high-frequency), as shown in Fig. 5D.

Comparison of the dual-energy modulation transfer functions (DE MTFs) as functions of (A) the wf, (B) Sn-filter thickness (tSn), (C) dose allocation (ξ), and (D) NR filtering. LE, low-energy; HE, high-energy; wf, weighting factor; μ, spatial frequency; NR, noise reduction; ACNR, anti-correlated noise reduction; GNR, Gaussian noise reduction; MNR, median noise reduction.
The effects of various wf, tSn, ξ, and NR filtering on the DE NNPS are shown in Fig. 6. It is worth noting that Equation (15) described the measured DE NNPS. These observations allowed us to consider flood-field images used in DE NNPS analysis as independent processes. This implies that the correlation between the two images obtained from the different X-ray energy is negligible. The DE NNPSs were increased closer to LE NNPS with increasing wf, because HE NNPS was added by the squared weighting-summation of LE NNPS, as shown in Fig. 6A. As shown in Fig. 6B, the NNPS performances for tSn were similar. When the NR filtering was not applied in Fig. 4B, the optimal SDNR performance was at ξ=0.3. These results also affected DE NNPS, and DE NNPS performance is best when ξ was 0.3, as shown in Fig. 6C. All the NR filtering resulted in lower NPSs than that of the DE images without NR. GNR and MNR filtering showed nearly the same noise performance at the overall spatial frequencies. Although the ACNR filtering showed higher noise performance than the GNR and MNR at the spatial frequencies below 1.3 mm-1, the ACNR filtering showed much lower noise performance, with respect to the other NR filtering at the spatial frequencies from 1.3 to 3.0 mm-1. Therefore, it was important for ACNR to improve noise performance at the middle frequency, and to find anatomical structures that the middle frequency component means in the DE images, as shown in Fig. 6D.
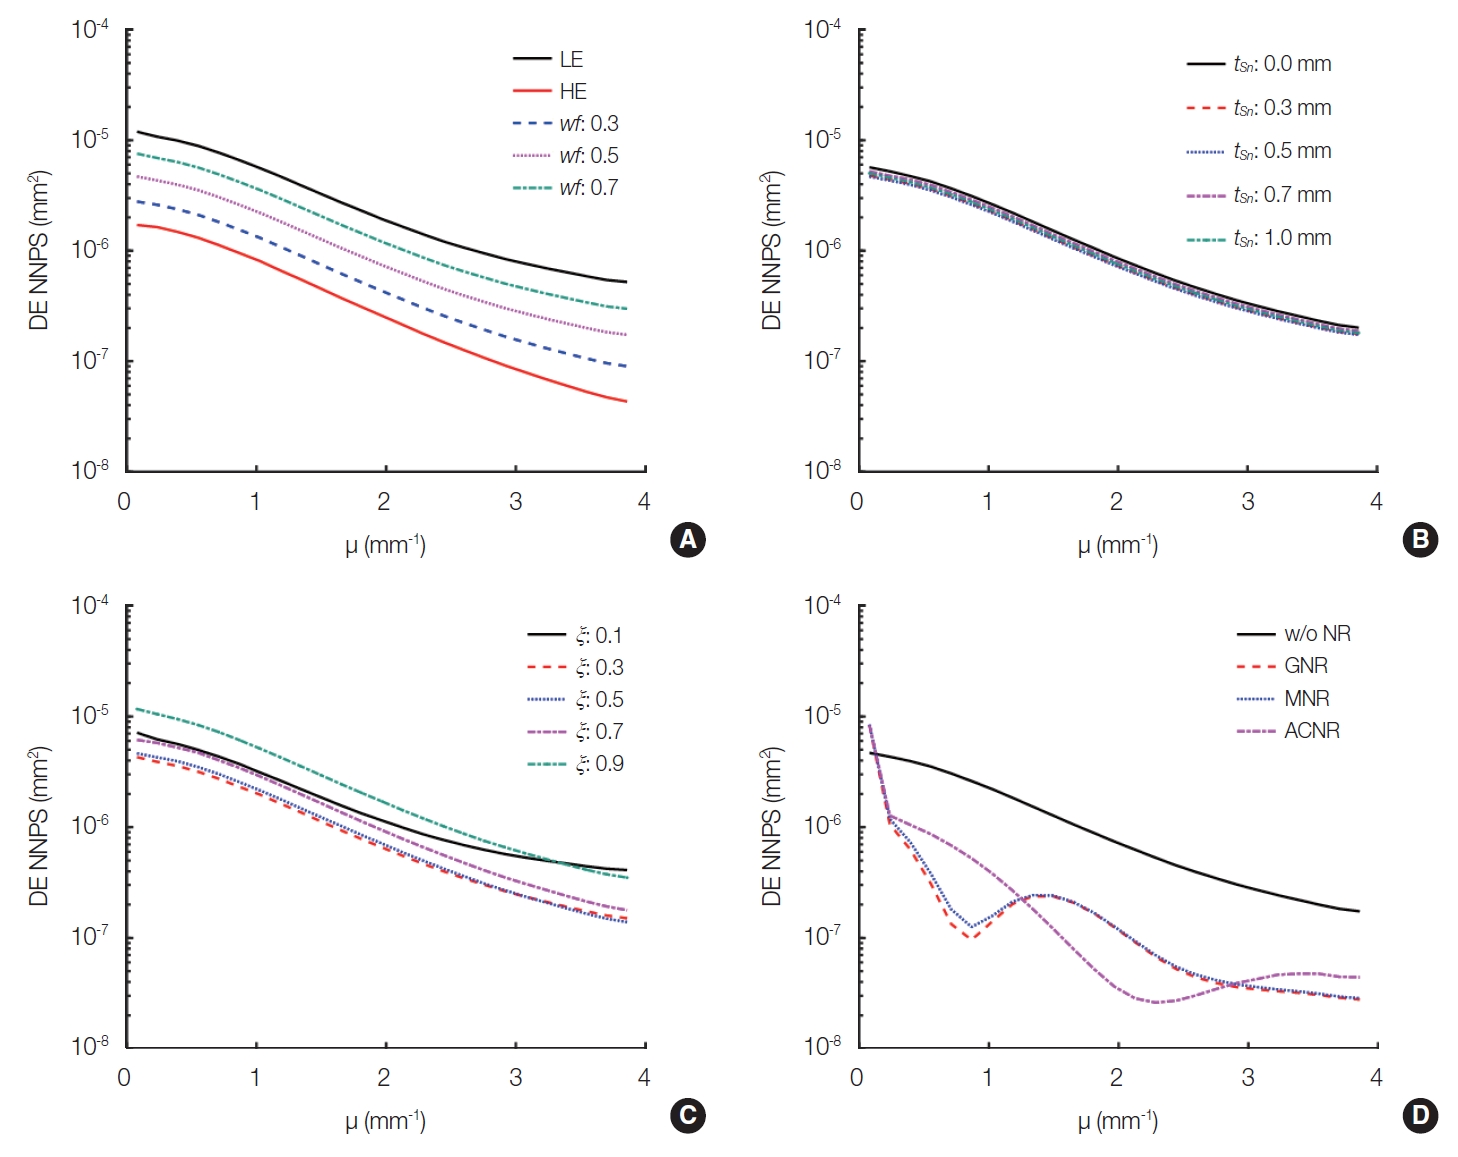
Comparison of the dual-energy normalized noise power spectra (DE NNPS) as functions of (A) the wf, (B) Sn-filter thickness (tSn), (C) dose allocation (ξ), and (D) NR filtering. LE, low-energy; HE, high-energy; wf, weighting factor; μ, spatial frequency; NR, noise reduction; ACNR, anti-correlated noise reduction; GNR, Gaussian noise reduction; MNR, median noise reduction.
The DE NEQ results are summarized in Fig. 7 for various wf, tSn, ξ, and NR filtering. As expected from the observations in the DE NNPS, the DE NEQ decreased with increasing wf and when wf was low, DE NEQ approached HE NEQ, as shown in Fig. 7A, and the DE NEQ was similar with increasing tSn as shown in Fig. 7B, and it was highest when ξ was 0.3, as shown in Fig. 7C. When a wf for DEI reconstruction increased, the performance of DE images including the DE MTF, NPS, and NEQ, was heavily influenced by the LE. Thus, increasing the wf, the DE MTF was subtracted by the wf ratio of the LE MTF, demonstrating this tendency, as shown in Fig. 5A and 5C. Particularly, NEQ has a term that squares MTF, which further reduces the MTF value of the 3 mm-1 frequency, resulting in the event that the NEQ value is degraded. Additionally, the GNR filtering showed higher DE NEQ performance than the MNR and ACNR at spatial frequencies below 2.0 mm-1, and the ACNR filtering showed higher DE NEQ performance, with respect to the other NR filtering at spatial frequencies above 2.0 mm-1, as shown in Fig. 7D.
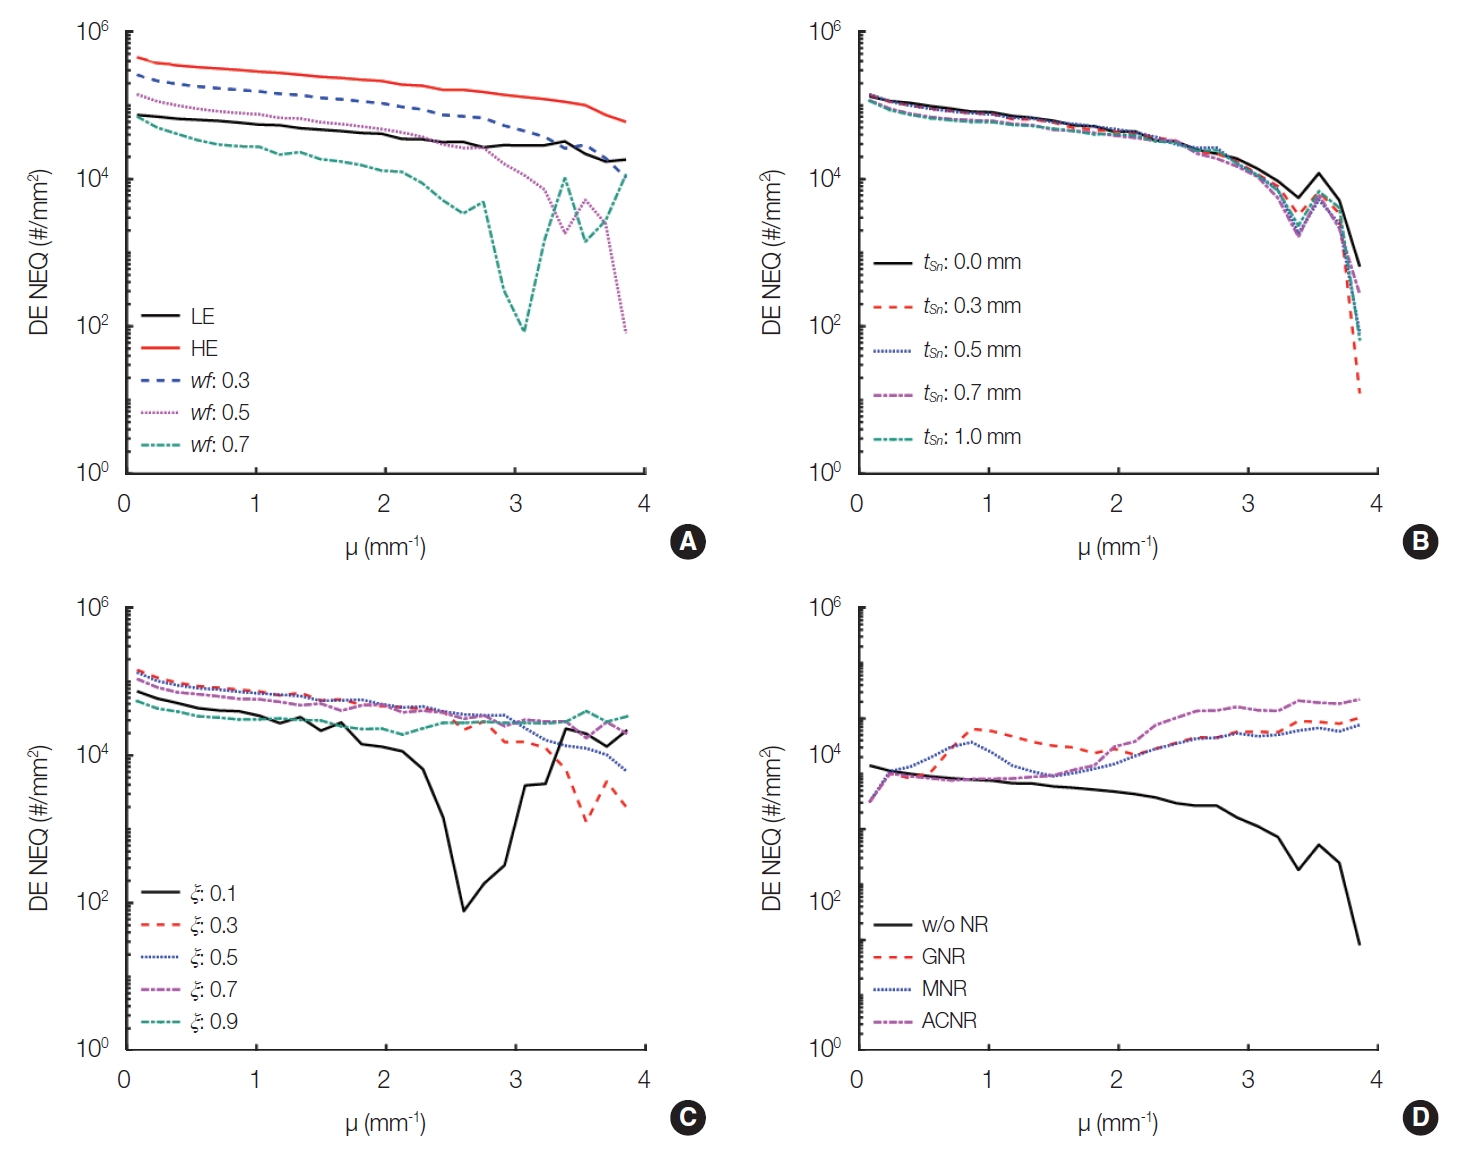
Comparison of the dual-energy noise-equivalent quanta (DE NEQ) as functions of (A) the wf, (B) Sn-filter thickness (tSn), (C) dose allocation (ξ), and (D) NR filtering. LE, low-energy; HE, high-energy; wf, weighting factor; μ, spatial frequency; NR, noise reduction; ACNR, anticorrelated noise reduction; GNR, Gaussian noise reduction; MNR, median noise reduction.
Conclusion
SDNR, MTF, NPS, and NEQ describing DE images obtained from the DEI technique have been investigated. The measured DE MTF affected the weighting factor and dose allocation. The measured DE NPS was the assumption of the independence between the two images used for the DE images. Therefore, the correlation between the two images obtained from the different X-ray energy might be negligible. Noise amplification in the DEI has been addressed by using the well-known NR filtering such as the GNR, MNR, and ACNR filtering. All the filtering were effective to reduce noise in the resultant DE images. The GNR and MNR emphasized further the inherent edge effect of DEI. The ACNR filtering indicated the best SDNR and noise performance in terms of NR performance. However, the ACNR filtering may require to find the optimal filter parameters according to every imaging tasks and imaging techniques. Defining cost or objective functions with appropriate constraints or quantitative indicators for optimization will be further research, including finding alternative NR filtering for imaging tasks and techniques.
Notes
Conflict of Interest
No potential conflict of interest relevant to this article was reported.
Author Contribution
Conceptualization: Song B, Kim C, Kim J. Funding acquisition: Song B, Kim C, Kim J. All the authors have proofread the final version.
Acknowledgements
This research was supported by Basic Science Research Program through the National Research Foundation of Korea (NRF) funded by the Ministry of Education (No. 2020R1-A6A3A01100169).