Radiation Monitoring in the Residential Environment: Time Dependencies of Air Dose Rate and 137Cs Inventory
Article information

Abstract
Background
Residential areas have some factors on the external exposure of residents, who usually spend a long time in these areas. Although various survey has been carried out by the government or the research institutions after the Fukushima Daiichi Nuclear Power Plant accident, the mechanism of radiocesium inventory in the terrestrial zone has not been cleared. To better evaluate the radiation environment, this study investigated the temporal changes in air dose rate and 137Cs inventories (Bq/m2) in residential areas and agricultural fields.
Materials and Methods
Air dose rate and 137Cs inventories were investigated in residential areas located in an evacuation zone at 5–8 km from the Fukushima Daiichi Nuclear Power Plant. From December 2014 to September 2018, the air dose rate distribution was investigated through a walking survey (backpack survey), which was conducted by operators carrying a γ-ray detector on their backs. Additionally, from December 2014 to January 2021, the 137Cs inventories on paved and permeable grounds were also measured using a portable γ-ray detector.
Results and Discussion
In the areas where decontamination was not performed, the air dose rate decreased faster in residential areas than in agricultural fields. Moreover, the 137Cs inventory on paved surfaces decreased with time owing to the horizontal wash-off, while the 137Cs inventory on permeable surfaces decreased dramatically owing to the decontamination activities.
Conclusion
These findings suggest that the horizontal wash-off of 137Cs on paved surfaces facilitated the air dose rate decrease in residential areas to a greater extent compared with agricultural fields, in which the air dose rate decreased because of the vertical migration of 137Cs. Results of this study can explain the faster environmental restoration in a residential environment reported by previous studies.
Introduction
The Japanese national project conducting the large-scale monitoring of air dose rate and radionuclide activity in extensive areas, particularly focused in areas within 80 km-radius of the Fukushima Daiichi Nuclear Power Plant (FDNPP), has been executed since the nuclear accident in 2011 [1–3]. This project has provided important information regarding the distribution and temporal changes in air dose rate and radionuclide activity. Conversely, the factors determining these distributions and temporal changes cannot be completely clarified using only large-scale monitoring results, because these factors are affected by local characteristics such as topography and land use [3–5]. Therefore, a more detailed investigation considering the effects of field characteristics is required.
Even though most of the areas affected by the FDNPP accident are covered by forest, residential environments, which significantly affect public exposure compared to the forest owing to long spent-time by residents [6], were also affected owing to the deposition of radionuclides [4, 5]. Radiocesium, especially 137Cs, is a major source of radiation contributing to long-term exposure compared with other radionuclides released during the FDNPP accident [6, 7]. Therefore, current and future air dose rate distributions and 137Cs activity in the residential environment are serious concerns for the government and population.
Several studies after the FDNPP accident have reported that air dose rates decrease faster with time in residential environments than in environments with other land uses [3, 7, 8]. The residential environment consists of multimedia, such as pavements and buildings, in addition to permeable areas like agricultural and grass fields. Studies after the Chernobyl Nuclear Power Plant accident showed decreases in air dose rate and 137Cs inventory depending on the surface types; a faster decrease in air dose rate and 137Cs inventory was observed on paved surfaces compared with that in permeable grounds [9–11]. A faster decrease in 137Cs inventory on paved surfaces was also reported in areas near the FDNPP [12]. This difference in 137Cs behavior between the residential environment and environments with other land uses could result in differences in the time dependency of the air dose rate. However, this mechanism has not been elucidated yet. Therefore, detailed monitoring of 137Cs in relation to air dose rate in residential environments is required to better understand this mechanism and to obtain effective and practical information that can be applied to ensure radiation protection.
In this study, temporal changes in air dose rate and 137Cs inventory (Bq/m2) in a residential environment were evaluated to provide a better understanding of the factors affecting these changes. This investigation was based on monitoring the data corresponding to the areas affected by the FDNPP accident obtained from December 2014 to January 2021.
Materials and Methods
1. Study Area
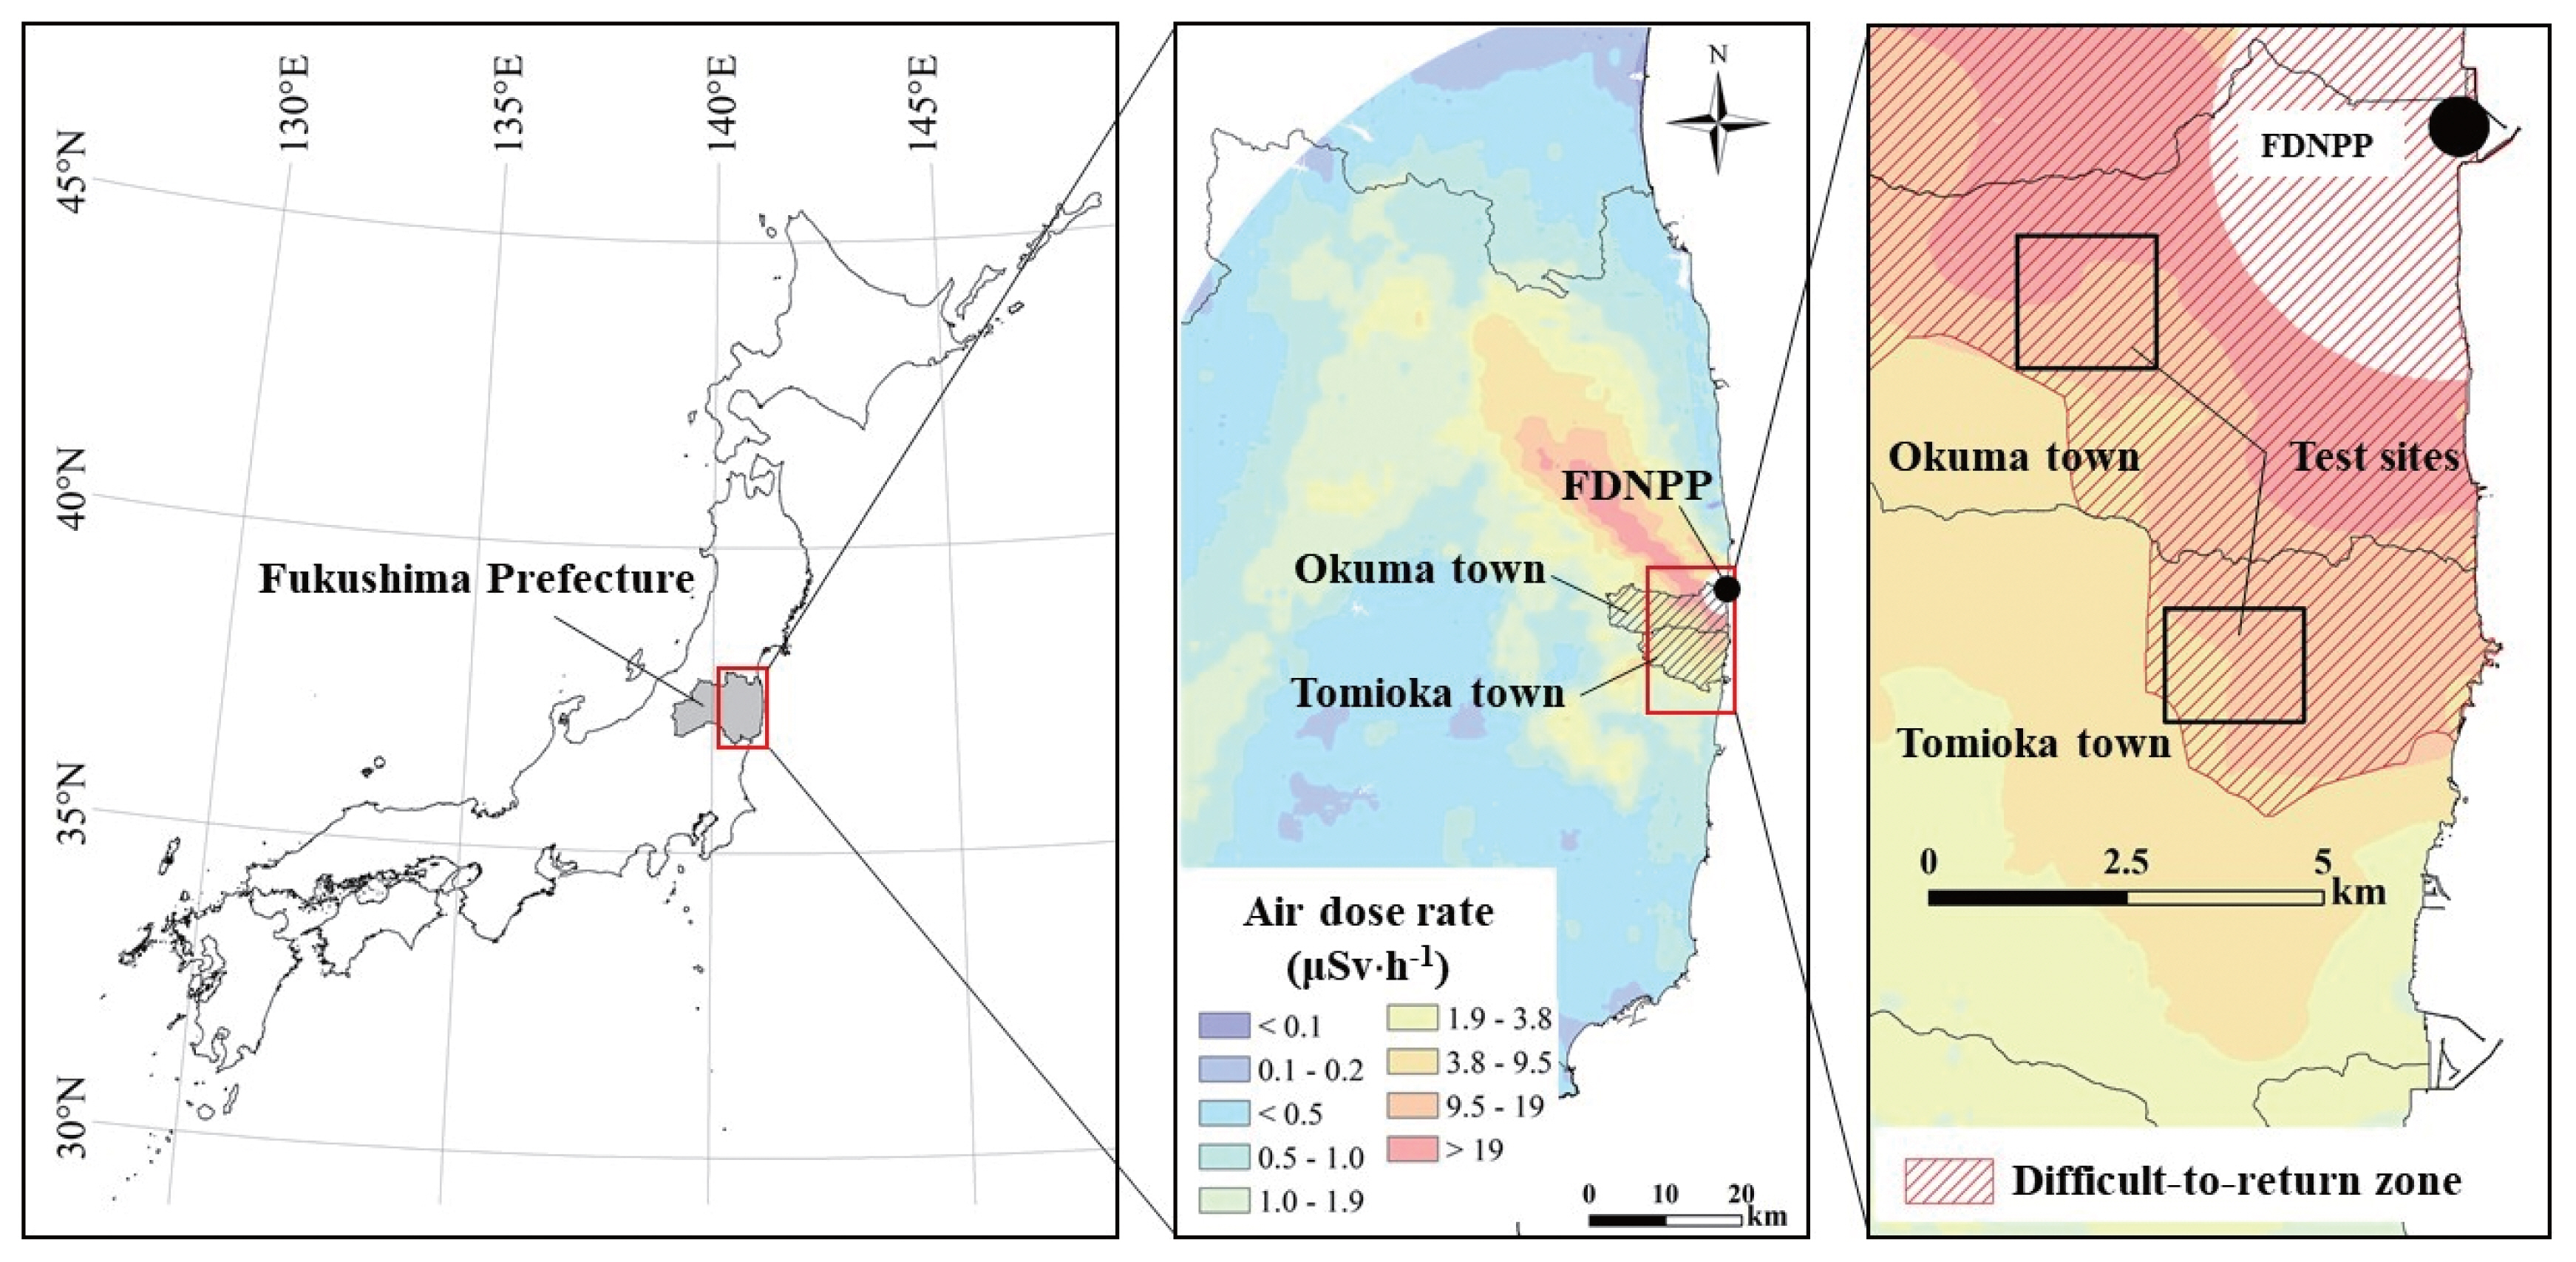
This study was conducted in test sites (1–2 km2) of Okuma town and Tomioka town, located at distances of 5–8 km from the FDNPP (Fig. 1). Because the test sites are located in an evacuation zone, human activities including traffic are limited. The land uses in the test sites comprises residential areas (61%), agricultural fields (31%), and others (8%) obtained from the land use data disclosed by National Land Numerical Information [14] using the geographic information system (GIS) (ArcMap. 10.6; ESRI Inc., Seoul, Korea).
2. Air Dose Rate
The air dose rate distribution at the height of 1 m above the ground level was measured using a second version of the Kyoto University Radiation Mapping (KURAMA-II) system equipped with a CsI(Tl) scintillation detector (C12137; Hamamatsu Photonics, Hamamatsu, Japan) and the GPS [15]. The air dose rate was estimated from the pulse height distribution obtained by the detector using a spectrum-dose conversion operator, G(E) function [16]. The operators carried the system on their backs during the survey and walked around the area. The data of air dose rate, time, and coordinates collected by the system at 3-second intervals were automatically stored in a server.
The surveys were conducted eight times from December 2014 to September 2018 (Table 1). To analyze the air dose rates corresponding to the different surveys, the data were averaged in each mesh area (100 m2), which was created according to the land use data [14] using the GIS.

Investigation Dates of Back Pack Survey
3. Inventory of 137Cs
This study measured the 137Cs inventory on paved and permeable surfaces using a portable Ge γ-ray spectrometer (Falcon-5000; CANBERRA, Montigny-Le-Bretonneux, France) equipped with a cylindrical collimator (30-mm-thick Pb with a height and a diameter of 60 and 170 mm, respectively) [12]. The γ-rays emitted from the ground were measured at the height of 1 m above the ground for 30 minutes. Under the measurement conditions, more than 90% of the detected γ-rays were derived from a circular surface with a diameter of 4 m below the detector. An In-Situ Object Calibration Software (ISOCS, CANBERRA) was used for efficiency calibration of the γ-ray spectra. The relaxation mass depth (β, g/cm2), representing the mass depth at which the radiocesium concentration is exponentially reduced to 1/e (Napier’s constant) of the concentration at ground level, is an essential parameter of the efficiency calibration. This study applied the β of 0.1 g/cm2 for paved surfaces. Conversely, the β on permeable surfaces increases with time. Therefore, the β on each investigation date was estimated from their time dependency reported by Nuclear Regulation Authority (NRA) [2]. The investigations were performed eleven times for paved surfaces and nine times for permeable surfaces from December 2014 to January 2021. The β applied to the spectral analysis for the permeable surfaces in each investigation was summarized in Table 2 with the investigation periods and site numbers of the measurement. The site numbers to measure the 137Cs inventory varied among the investigation because of the addition of measurement sites to increase the data number and discontinuance of the measurement on the sites under construction.

Investigation Periods and Site Numbers to Measure the 137Cs Inventory on Permeable and Paved Surfaces
To analyze the data across measured surfaces with different deposition levels, the inventory was normalized by the initial deposition amount at each site. The initial deposition amount on November 5, 2011, was obtained from the result of the Fourth Airborne Monitoring Survey by the Ministry of Education, Culture, Sports, Science and Technology (MEXT) [13] because the survey result is the earliest map data of 137Cs inventory covering the test site in this study.
Results and Discussion
1. Decrease in the Air Dose Rate
As an example of the time series of air dose rate distribution, the distribution map obtained in Okuma town is shown in Fig. 2. The air dose rate in most of the area was over 2.0 μSv/h in December 2014, and generally, decreased with time. Houses, roads, trees, and other permeable grounds in parts of the test sites were decontaminated four times before the surveys in December 2014, July 2016, December 2016, and September 2017. Overall, impermeable surfaces (such as building surfaces and asphalt roads) were decontaminated by manual removal of the surface sediments, wiping, brushing, high-pressure water washing, shot blasting, and scraping, depending on the decontamination efficiency [17, 18]. Decontamination of trees was performed by litter and surface soil removals, branch trimming, and trunk washing. Decontamination on permeable grounds was performed by topsoil stripping. The air dose rate in the decontaminated areas, including both residential areas and agricultural fields, clearly decreased compared with those observed in other areas, and most of the air dose rates reached values below 1.0 μSv/h in 2018. The obvious decrease in air dose rate after the decontamination was similarly found in Tomioka town.
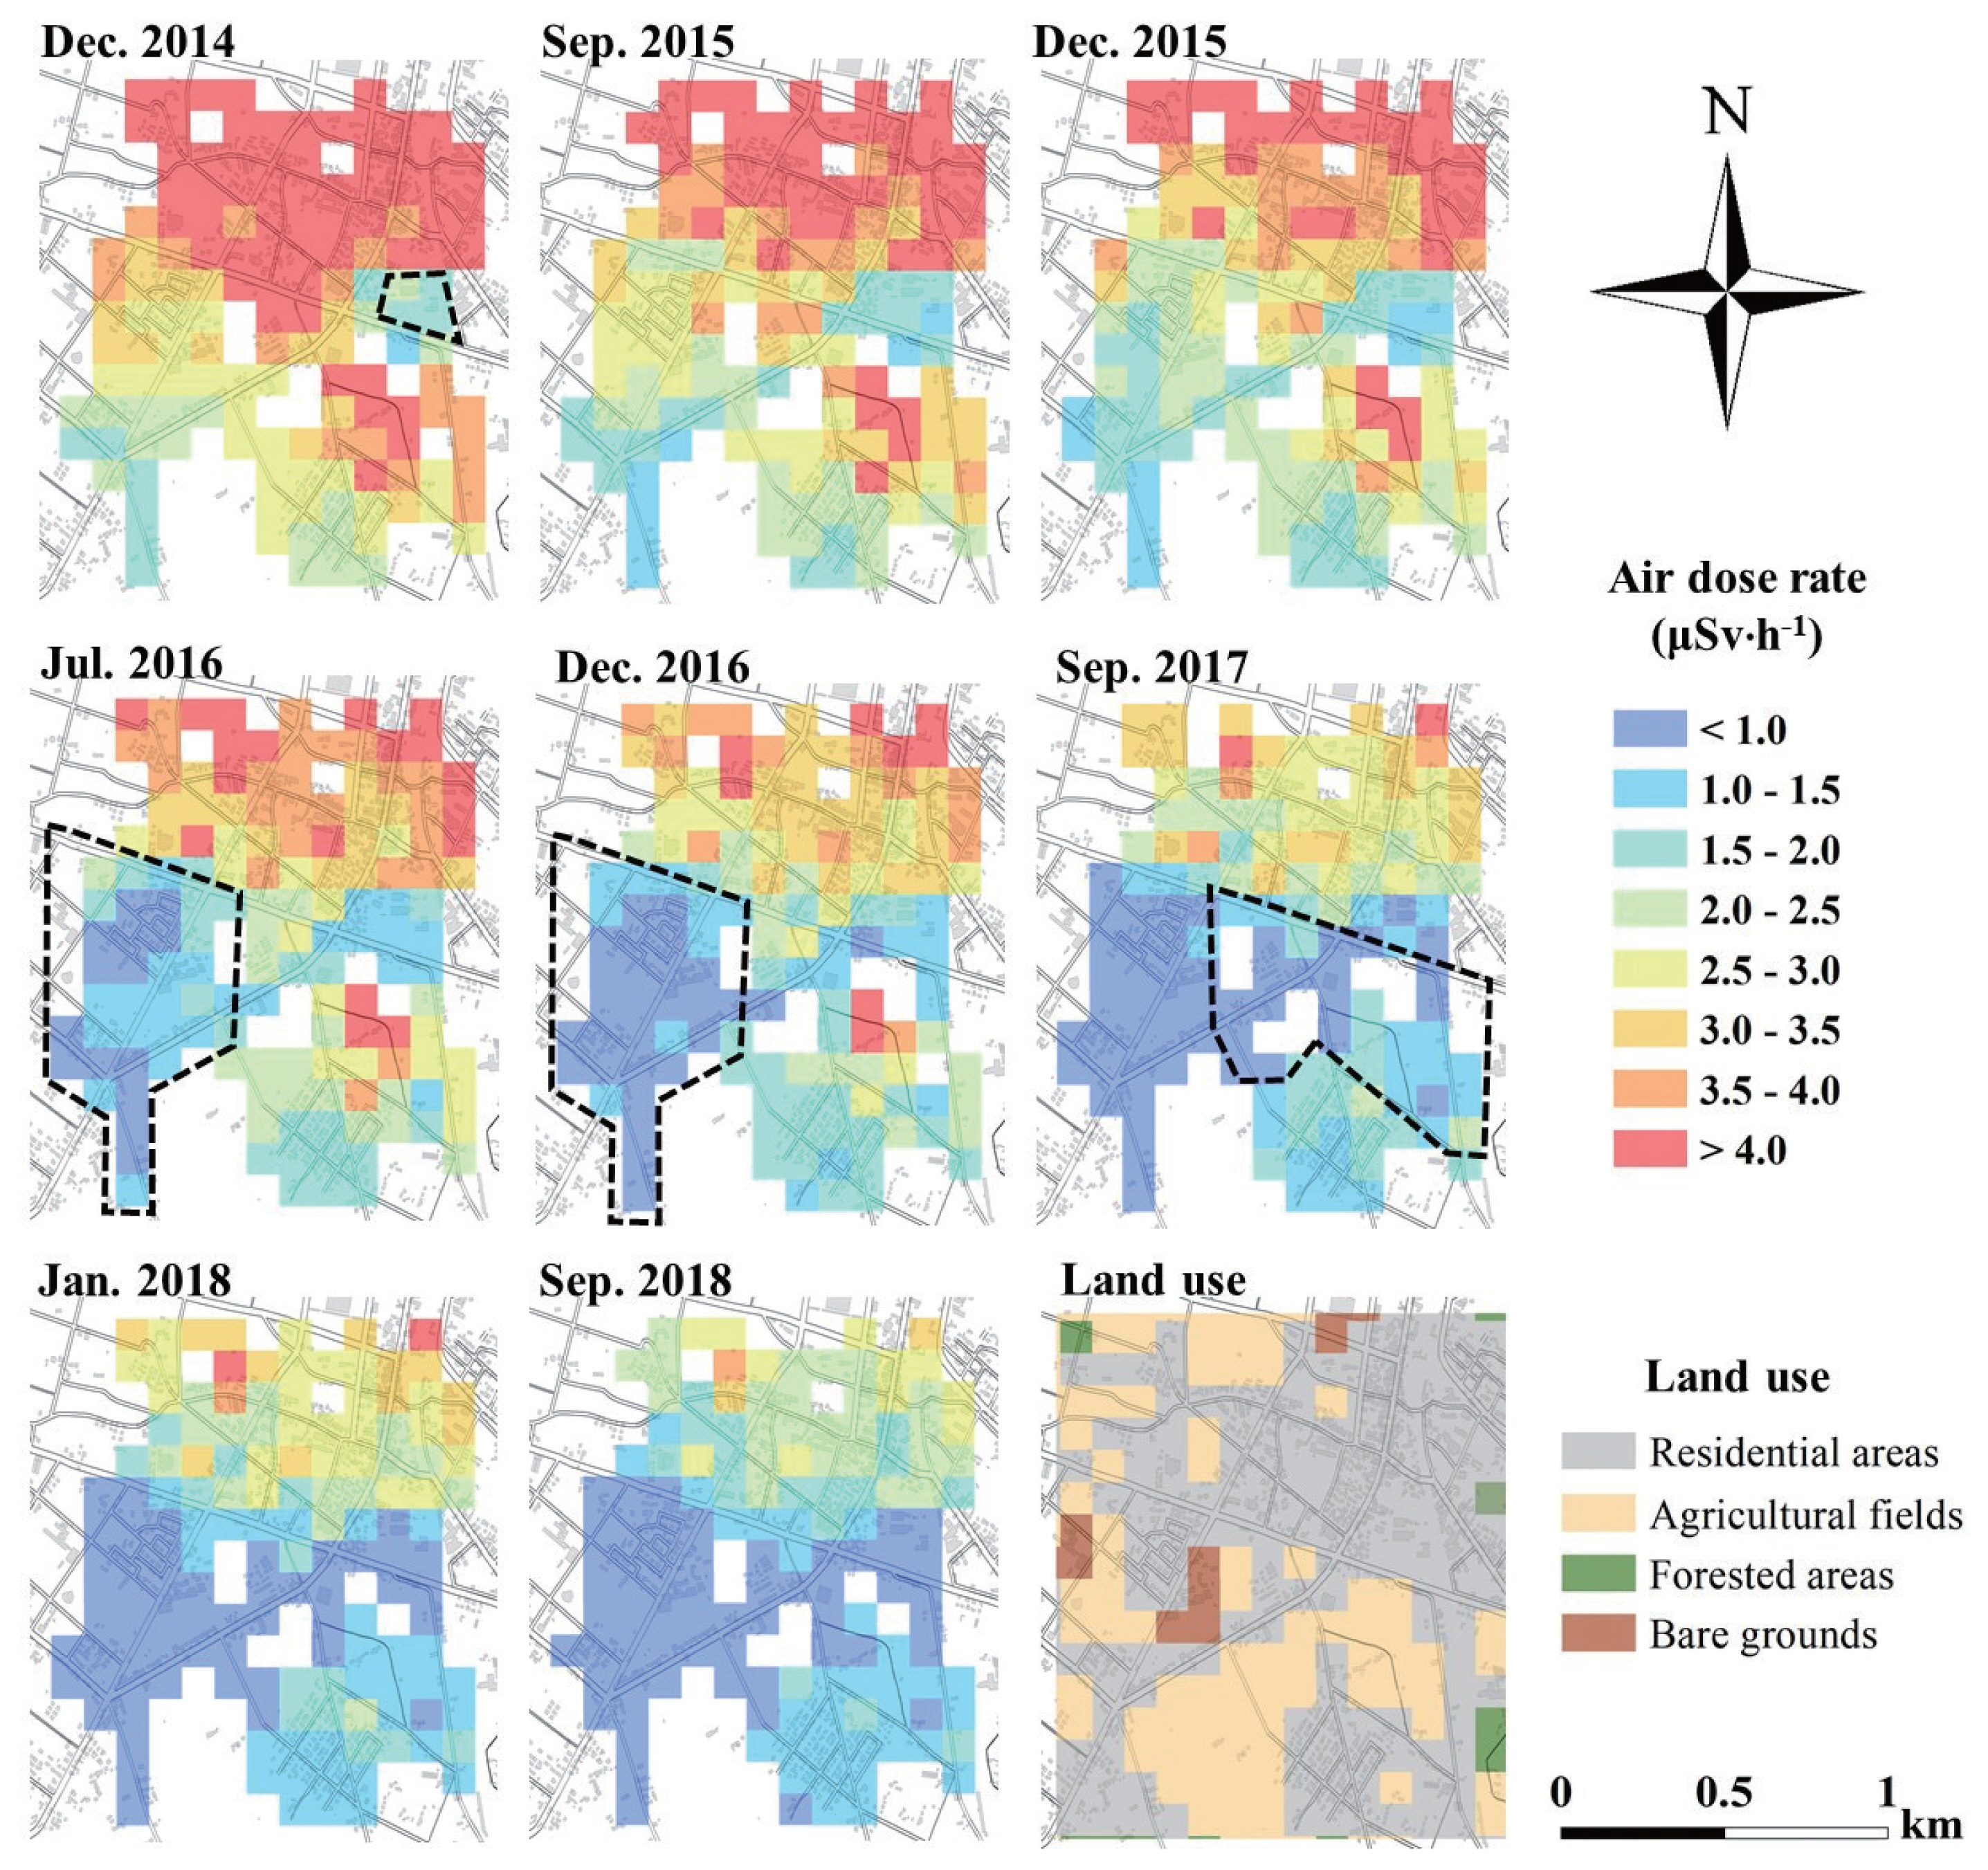
Time series of air dose rate distribution from December 2014 to September 2018 obtained by the backpack survey in Okuma town. The zones surrounded by broken lines indicate the areas that were decontaminated before each investigation (i.e., the lower-left area was decontaminated during December 2015 and December 2016, and the lower-right was decontaminated during December 2016 and September 2017). All of the area was included in the difficult-to-return zone. Land use obtained from National Land Numerical Information provided by the Ministry of Land, Infrastructure, Transport and Tourism [13] is also shown.
The average and the range of the air dose rate observed in the entire test area and the decontaminated area are summarized in Table 3. The air dose rate average in the entire test area decreased from 3.8 to 1.3 μSv/h during the investigation period from December 2014 to September 2018. The average air dose rate in the decontaminated area was nearly half of that in the entire area in 2018.

The Average and the Range of Air Dose Rates Observed in the Whole Test Area and the Decontaminated Area
Fig. 3 shows the temporal decrease in the air dose rates, represented as relative values with respect to the air dose rate obtained during the first investigation (December 2014) in both Okuma town and Tomioka town. The decreasing rates were 0.23 and 0.20 per year in residential areas and agricultural fields, respectively. The faster-decreasing rate in residential areas compared with agricultural fields is consistent with the results obtained in previous related studies [3, 7, 8]. Nakama et al. [19] monitored air dose rates on different surfaces (paved surfaces and permeable grounds) at 163 points using a NaI surveymeter for 4 years, beginning in 2012. According to this study, the decrease in air dose rate was statistically faster on paved surfaces (asphalt) compared with that on permeable grounds (plane soil ground). This difference in the decreasing trends between paved surfaces and permeable grounds can be the reason for the faster-decreasing rate in residential areas.
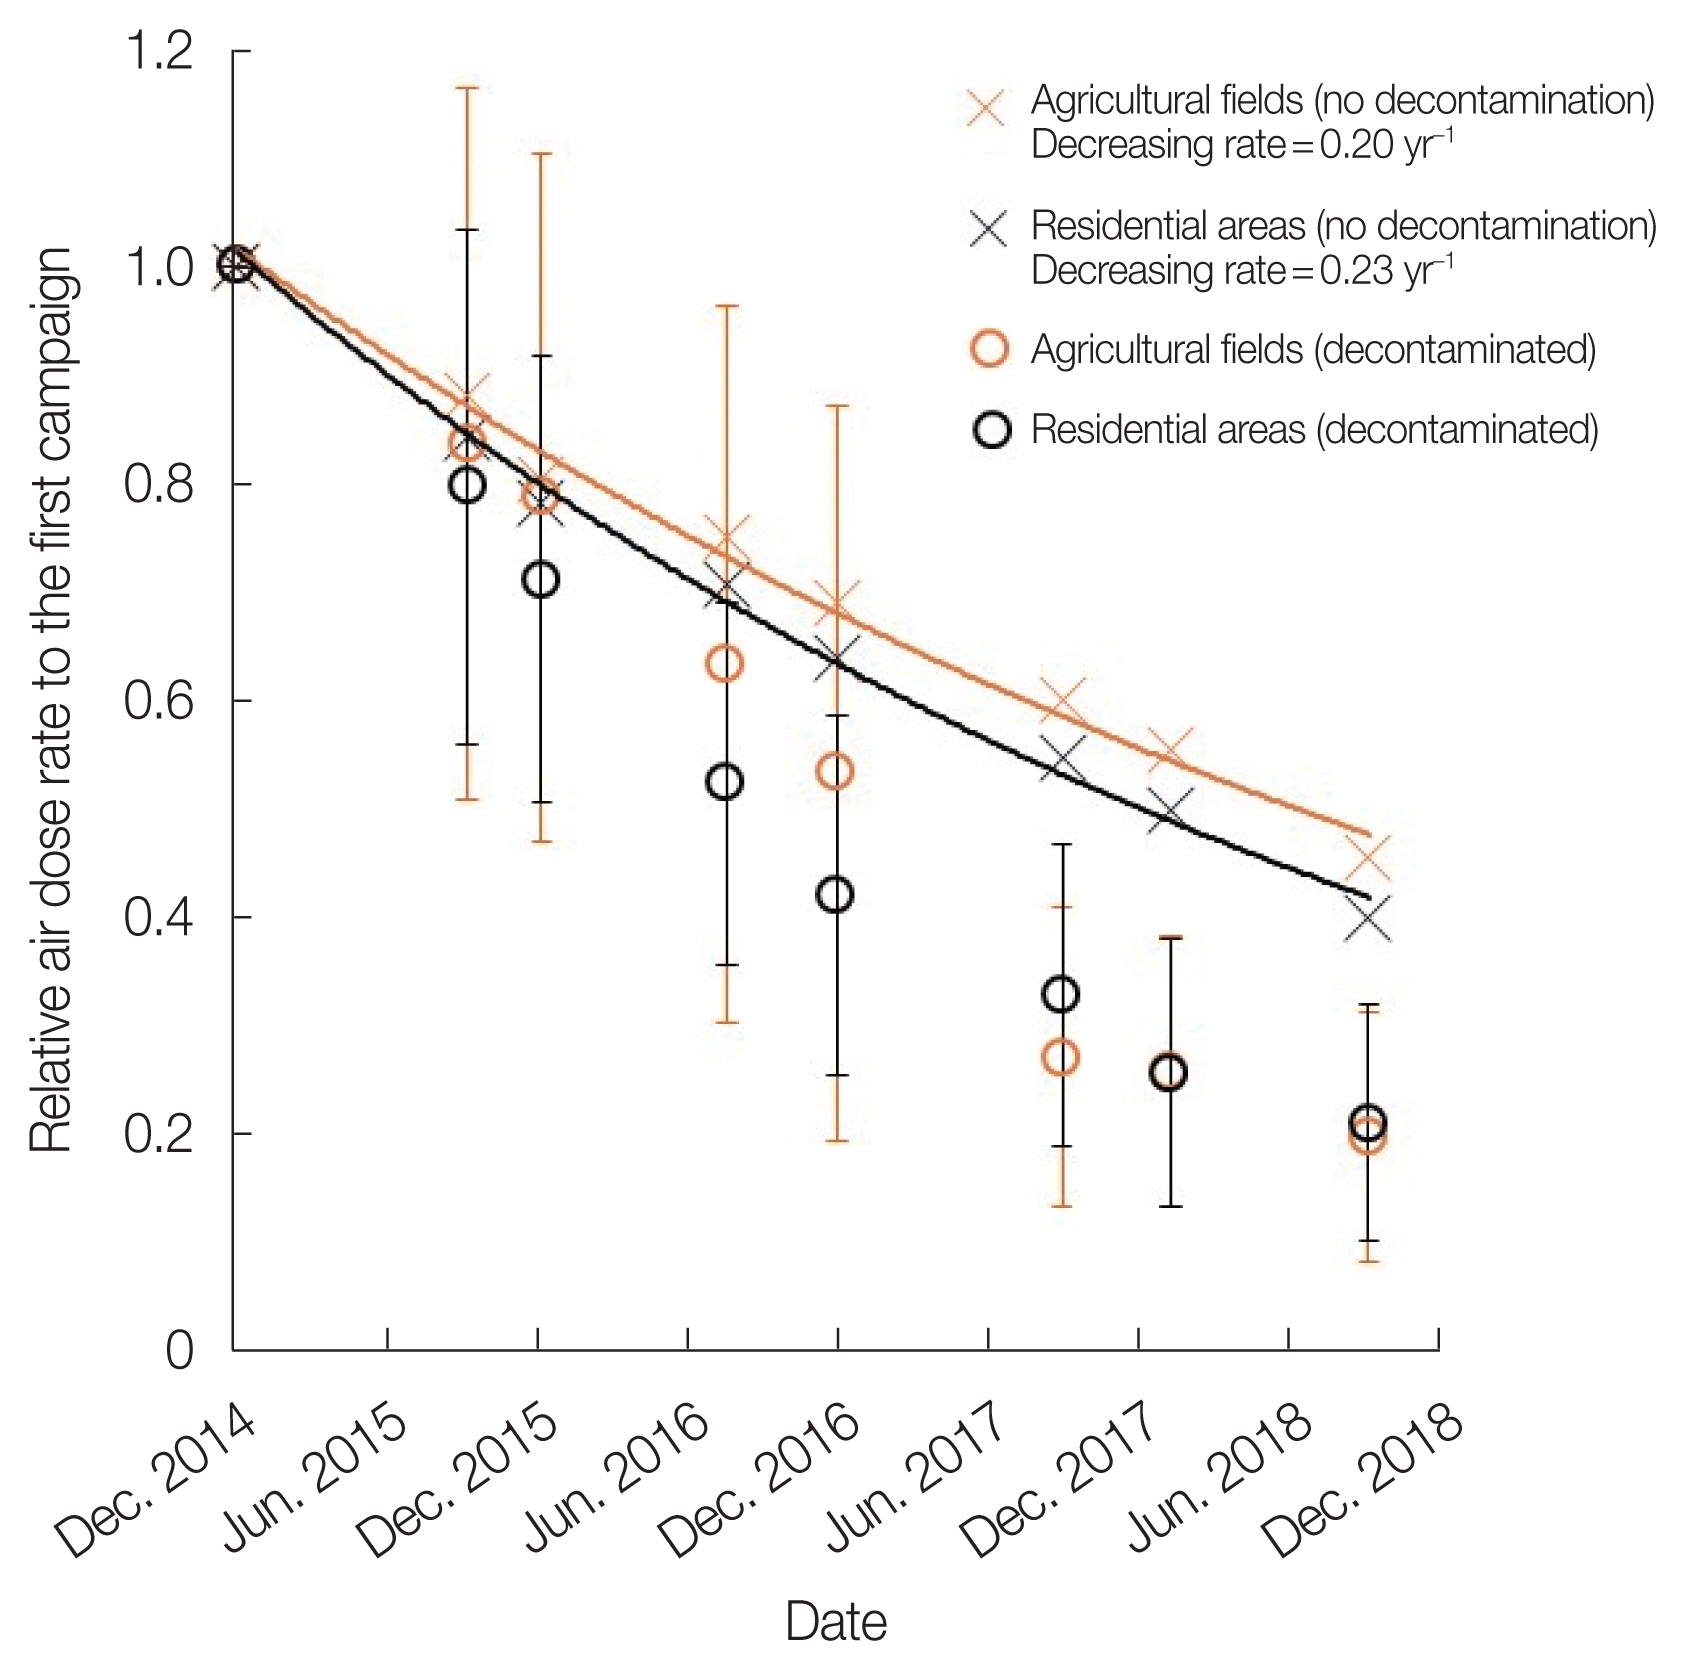
Temporal decrease in air dose rate, relative to December 2014 values, observed for each land use. The error bars represent standard deviation. The solid lines represent regression lines for the air dose rate obtained in the areas without decontamination.
Decontamination was performed in residential areas mainly in 2016, while intensive decontamination in agricultural fields was conducted in 2017 in the test area. The decontaminations in 2016 and 2017 clearly reduced the air dose rate in both areas (Fig. 3). The relative air dose rates in both the decontaminated residential areas and agricultural fields accounted for 57% and 46% of the values in the areas without decontamination in September 2018 (7.5 years after the accident), respectively. The residential areas showed slightly less decontamination efficiency compared with the agricultural fields, consistent with the decontamination efficiency reported so far [17, 18]. This difference in the decontamination efficiency can be attributed to the difference in the decontamination methods used on the distinct surfaces [20], and also the components of residential areas and agricultural fields. Regarding agricultural fields, most of the radiocesium deposited on the ground was retained on the surface soil and was easily removed by topsoil stripping. In contrast, paved surfaces, which represent the dominant surface in the residential areas, are usually decontaminated through brush cleaning, high-pressure washing, and shot blasting in the test area. Shot blasting is the most effective decontamination method to reduce the surface count rate among the methods mentioned above. However, the shot blasting reduces the surface count rate to 60%–95% of the initial value [18], implying that a certain proportion of radiocesium remains on the paved surfaces after decontamination. Additionally, the air dose rate in residential areas reflects not only the γ rays emitted from paved surfaces but also objects around the roads such as bushes and trees, of which the decontamination efficiency is usually small. Therefore, the difference in the decontamination methods and the area components can be the reason for the differences in decontamination efficiency between residential areas and agricultural fields.
2. Temporal Changes in the 137Cs Inventory
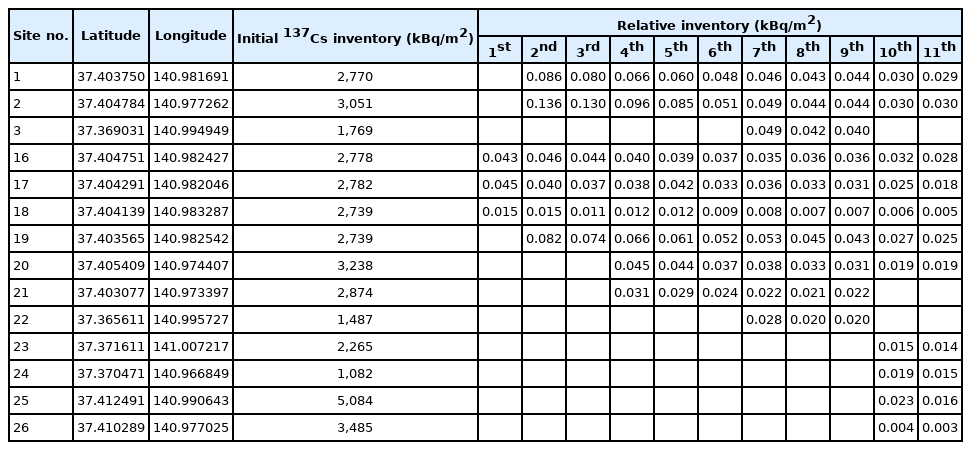
To confirm the effect of 137Cs migration on the decrease in the air dose rate, the 137Cs inventory (Bq/m2) on permeable and paved surfaces was monitored within the 2014–2021 period. The relative 137Cs inventory, which is a relative value to the initial 137Cs deposition amount on November 5, 2011 [13], and the initial 137Cs deposition amount are summarized in Tables 4–6. The initial 137Cs deposition amount ranged from 1,082 to 5,084 kBq/m2. Fig. 4 shows the time dependency of the relative 137Cs inventory on each surface obtained in both Okuma town and Tomioka town. The relative inventories on permeable surfaces were close to 1 and varied throughout the investigation period; no clear trend of the inventory was observed. The 137Cs inventory variation on the permeable surface was probably a result of the variation on the site conditions (i.e., the water content in soil and vegetation) and surface soil agitation by animals. The minor temporal changes in the inventory on the plane permeable surface corresponded to the results of the long-term/extensive monitoring of the 137Cs inventory [21]. The negligible loss of radiocesium on permeable surfaces indicated that the decrease in the air dose rate in agricultural fields was mainly facilitated by the downward migration of radiocesium.

Location, Initial 137Cs Inventory and Relative Inventory on Permeable Surfaces

Location, Initial 137Cs Inventory and Relative Inventory on Paved Surfaces (No Decontamination)
Location, Initial 137Cs Inventory and Relative Inventory on Paved Surfaces (Decontaminated)

Temporal changes in 137Cs inventory relative to the initial deposition amount (i.e., November 5, 2011) obtained from the results of the Fourth Airborne Monitoring Survey conducted by the Ministry of Education, Culture, Sports, Science and Technology [12]. The error bar represents standard deviation.
Conversely, paved surfaces showed a small relative inventory of less than 0.35 in December 2014 even without decontamination, and the value decreased with time reaching 0.12 in January 2021. The relative inventory on decontaminated paved surfaces exhibited small values, accounting for 10%–20% of the values on paved surfaces with no decontamination. Even after the decontamination, the relative inventory further decreased with time. These results demonstrate that large amounts of radiocesium deposited on the paved surface were removed by initial run-off followed by wash-off as a result of the precipitation in addition to the decontamination [12]. Because the radiocesium on paved surfaces remains at the top surface and does not show vertical migration with time [22, 23], the horizontal wash-off of radiocesium was identified as a major factor facilitating the decrease in the air dose rate on paved surfaces. Because the paved surface can be a major radiation source in residential areas, our results probably explain the faster environmental restoration in a residential environment reported so far.
Conclusion
This study demonstrated the different temporal changes in air dose rate and the differences in the decontamination effect on residential areas and agricultural fields. The difference in time dependency of air dose rate resulted from differences in 137Cs migration and retention in permeable and paved surfaces. Therefore, the surface condition is an important factor affecting the environmental restoration associated with the 137Cs transfer in the residential environment.
Acknowledgements
This study was partially supported by Research project on the Health Effects of Radiation organized by Ministry of the Environment, Japan.
Notes
Conflict of Interest
No potential conflict of interest relevant to this article was reported.
Author Contribution
Investigation and methodology: Nakama S, Fujiwara K, Yoshimura K. Formal Analysis, Writing of the original draft, review and editing: Yoshimura K.