Annual Effective Dose of 210Po from Sea Food Origin (Oysters and Mussels) in Korea
Article information
Abstract
Background
Ingestion of 210Po laden seafood accounts for a substantial amount of the effective dose of 210Po. Among seafood items, mollusks, especially domestically produced oysters and mussels, are highly enriched in 210Po and are consumed in large quantities in Korea.
Materials and Methods
Oysters and mussels around the Korean coasts were collected from major farm areas in November 2013. Samples were spiked with an aliquot of 209Po as a yield tracer, and they were digested with 6 mol·L−1 HNO3 and H2O2. The 210Po and 209Po were spontaneously deposited onto a silver disc in an acidic solution of 0.5 mol·L−1 HCl and measured using an alpha spectrometer. The activity concentrations of 210Pb and 210Po were decay corrected to the sampling date, accounting for the possible in-growth and decay of 210Po.
Results and Discussion
210Po activity concentrations in oysters were in a range from 41.3 to 206 Bq·(kg-ww)−1 and mussels in a range from 42.9 to 46.7 Bq·(kg-ww)−1. The 210Po activity concentration of oysters in the turbid Western coast was higher than the Southern coast. The 210Po activity concentration of the oysters was positively correlated (R2=0.89) with those of the suspended particulate matter in the surface water. The calculated annual effective dose of 210Po from oysters and mussels consumed by the Korean population was 21–104 and 5.01–5.46 μSv·y−1. The combined effective dose due to the consumption of oysters and mussels appears to account for about 35±19% of that arising from seafood consumption in the Korean population.
Conclusion
The annual effective dose of 210Po for oysters in the Korean population was found to be higher than other countries. The total annual effective dose of 210Po due to consumption of oysters and mussels consumed in Korea was found to be 76±42 μSv·y−1, accounting for 28±16% of the total effective dose of 210Po from food in Korea.
Introduction
Polonium was discovered in 1898 by Marie and Pierre Curie during their studies of thorium and uranium [1]. 210Po appears in the decay chain of 238U, emitting relatively high alpha-ray energy of 5.3 MeV among its daughter nuclides and has a radioactive concentration of 1.66 TBq·g−1 [2, 3]. According to the hazard function (HF) model, daily intake of 210Po at 1 MBq per 1 kg of body weight may cause damage to the kidneys or other organs, and reduce the number of lymphocytes, leucocytes, erythrocytes, and hemoglobin in the body, generally causing death in 28 days or less [4].
In a marine environment, 210Po is produced by radioactive decay of 210Pb through radioactive decay of 226Ra in seawater, or the fall of the daughter nuclides of inert gas 222Rn emitted to the atmosphere in the decay chain of 238U from the Earth’s continental crust. After being emitted to air, 222Rn changes into 210Pb, 210Bi, or 210Po with long half-lives from nuclides with shorter half-lives [5]. 210Po included in seawater is absorbed by phytoplankton and is biologically concentrated as it travels through the upper food chain of the marine ecosystem [6]. 210Po is then absorbed into the human body by seafood intake. The annual effective dose of 210Po from seafood consumption is reported to account for almost 87% of its total annual effective dose through all food consumption [7]. Research shows that countries like Poland, Japan, Korea, and India have an especially high annual effective dose of 210Po through seafood intake [8–11]. In addition, mollusks are known to have much higher 210Po concentration than fish among various other types of seafood by 1.7 times to 40 times [12–15].
Most shellfish are filter feeders that clean up suspended organisms or plankton on seawater [16, 17]. During this process, they intake dissolved 210Po along with other heavy metals [18]. The level of metal contamination of sea water is often measured by the amount of metal included in oysters or mussels, which accumulates of metal inside thebody [19].
The data shown on fish statistics 2002–2012 by the Food and Agriculture Organization of the United Nations put Korea’s oyster production volume as the second highest among 49 nations, and that of mussels 8th among 50 nations. The 6th raw data in 2013 of the Korea Centers for Disease Control and Prevention reported that Koreans intake up to 244 g of oysters and 251 g of mussels per day. The country’s self-sufficiency ratio of shellfish is high at 84.6%, and a large part consists of domestically produced oysters and mussels [20].
Oysters and mussels contain a wide range of 210Po depending on the region. Therefore, the annual effective dose of 210Po from oyster and mussel intake also varies largely by region [21–27]. However, there has been no research conducted within the Korea on annual effective dose of 210Po from oyster and mussel intake, although the country has high production and intake volume of both of the shellfish. This study investigates the amount of 210Po contained in the edible parts of oysters and mussels produced in the Southern and Western coasts of the Korean peninsula and estimates the annual effective dose of 210Po from oyster and mussel intake.
Materials and Methods
1. Sample preparation
Oysters and mussels are largely produced in the farms of Seosan, Boryeong, Wando, Yeosu, and Tongyoung, located on the Western and Southern coasts of Korea [28]. We purchased oysters (Crassostrea gigas) raised in Seosan, Boryeong, Wando, Yeosu, and Tongyeong and mussels (Mytilis coruscus) from Yeosu and Tongyeong in November 2013 to use as samples (Figure 1). The edible parts were used as samples and more than 10 kg per each region was collected in order to ensure reliability. The refrigerated samples were transported to the lab and rinsed with distilled water to remove the dirt. Then, the samples were freeze-dried, ground, mixed, and divided into three pieces. Samples for analysis of 0.3 g were collected from each piece. The results were marked as the average±standard deviation after repeating the test three times.
Map of the sampling locations for oysters and mussels.
2. Analysis
An amount of 0.3 g of the specimen was put into a 250 mL Teflon beaker, and 17 mBq of 209Po was added as the yield tracer. Next, 20 mL of 6 mol·L−1 HNO3 and 0.5 mL of H2O2 were left at room temperature overnight then heated up to 70°C on a heating plate to evaporate the HNO3 until the samples were completely decomposed. If some substances remained undecomposed, we repeated the heating process after adding 4 mL of conc. HF and conc. HNO3. After the acid was evaporated at 70°C, we repeatedly added 2 mL of conc. HCl and heated it until the dissolvent turned from HNO3 to HCl. The completely dried samples were melted with 100 mL of 0.5 mol·L−1 HCl.
In order to prevent Fe3+ being attached on the silver disc before polonium, 0.5 g of ascorbic acid was added to the prepared samples. The silver disc (99.9% Ag, Φ 24.1 mm×0.15 mm) was painted with enamel so that 210Po and 209Po could be settled on one side, put into the sample, and 210Po and 209Po fixed onto the disc with continuously stirring on magnetic stirrer for 15 hours. After removing the HCl stuck on the disc with distilled water and drying the disc off, 210Po and 209Po were measured with an alpha spectrometer (Canberra Industries Inc., Meriden, CT). The measurement was carried out for a sufficiently long time to minimize errors under the same conditions, and the net 210Po and 209Po counts were obtained after deducting the instrumental background concentration from the original counts. Final correction was done for the decay of 210Po and the in-growth of 210Po through the decay of 210Pb during the interval of when the samples were collected and the analysis was carried out.
To confirm the reliability of the analysis, we also measured the reference material (IAEA-414) in mixed fish, which had similar characteristics with the samples, and then conducted the same experiment. The 210Po concentration of the reference material measured in this study was 2.2±0.1 Bq·(kg-dw)−1(dry weight) (average±standard deviation). This was within a 5% error range of the presented data of 2.1 Bq·(kg-dw)−1 and within a confidence level of 1.8–2.5 Bq·(kg-dw)−1 (Table 1).
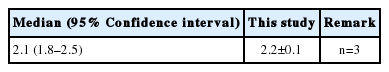
Analytical Accuracy of 210Po Using Reference Material, IAEA-414 (Radionuclides in Mixed Fish from the Irish Sea and North Sea) [unit: Bq·(kg·dw)−1]
Results and Discussion
1. 210Po concentration in oysters and mussels
The 210Po concentrations in the edible parts of oysters collected in five regions of the Western and Southern coasts are presented in Table 2. The 210Po concentration was between 41.3±3.7 and 206±10 Bq·(kg-ww)−1, showing a wide range. The 210Po concentrations in oysters collected from Tongyeong and Yeosu, Southern coastal regions, were 41.3±3.7 Bq·(kg-ww)−1 and 55.8±21.2 Bq·(kg-ww)−1, respectively, lower than the oysters from Seosan, Boryeong, and Wando, the Western and Southwesterncoastal regions (110±18 to 206±10 Bq·(kg-ww)−1) by several folds. A comparison of the 210Po concentration measured in this study with those of the oysters produced in other regions of the world is presented in Table 3. The Tongyeong and Yeosu oysters, which had a relatively lower level of 210Po than the other regions, contained more than twice as much 210Po as oysters inhabiting the Western English Channel of France and the Taiwanese coasts (14.3 to 25.9 Bq·(kg-ww)−1) [21, 27], while the Crassostrea madrasensis oysters found on the Eastern coasts of India, which is a different species from Korea’s Crassostrea gigas, had a similar 210Po level as the oysters collected on the Southern coast of Korea [15]. The Ostrea edulis species inhabiting the Slovenian coasts contained a similar amount of 210Po as the result of our study at a range of 56.7 to 125 Bq·(kg-ww)−1 [22]. Compared with oysters from the other seas in the world, the oysters produced in the Western coast seas of the Korean Peninsula contained a significantly high level of 210Po within a range of 110±18 to 206±10 Bq·(kg-ww)−1.
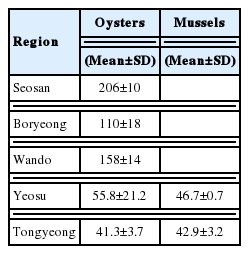
Activity Concentrations of 210Po in the Soft Tissues of the Oysters and Mussels Collected in Various Korean Coastal Areas (n=3) [unit: Bq·(kg·ww)−1]
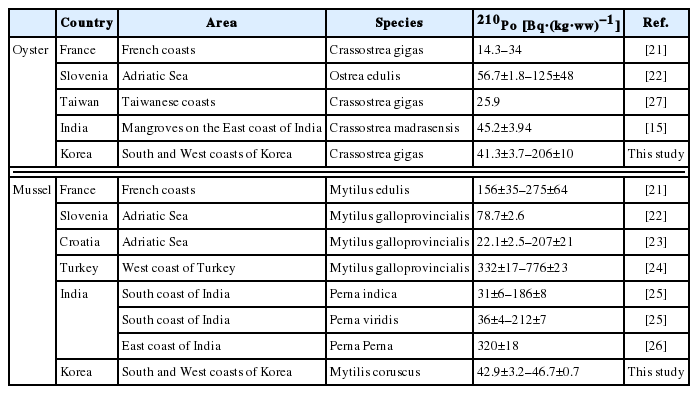
Comparison of 210Po Activity Concentrations in the Oysters and Mussels of Other Countries with Those of This Study
The concentrations of 210Po in the mussels collected in the Tongyeong and Yeosu areas, the Southern coastal regions of Korea, were 42.9±3.2 Bq·(kg-ww)−1 and 46.7±0.7 Bq·(kg-ww)−1 each, similar to those in the oysters from the same region (Table 2). The mussels used in this research were the different species as those from five countries: Croatia, India, Slovenia, Turkey, and France [21–26]. The range of 210Po concentration was very wide at 22.1–776 Bq·(kg-ww)−1. The concentration level of 210Po in Turkish mussels was the highest between 332 and 776 Bq·(kg-ww)−1 [24]. This was ten times higher than the level in the mussels from Tongyeong and Yeosu. The average concentration of 210Po for domestically produced mussels was 44.8±2.7 Bq·(kg-ww)−1, twice as much as mussels produced in Croatia (22.1±2.5 Bq·[kg-ww]−1) (Table 3) [23].
The level of 210Po concentration in marine biota may differ according to the geographical characteristics of the habitats, feeding habits, biological processes, size, seasonal changes, and species [29]. Oysters, a type of filter feeder, may show different levels of 210Po based on the type of suspended particle matters that they intake. Previous studies have found that oysters filter feed in a way to intake only the planktons they prefer, or randomly intake planktons and inorganic particles [16, 17]. In order to understand the reason why the level of concentration of 210Po varies across regions, we investigated the correlations between the amount of suspended particle matter, or SPM, on the seas of the region the oysters were collected in, and Chl-a, an indirect indicator of the volume of existing plankton. We referred to Marine Environment Information System (MEIS) data between 2003 and 2013 for the level of SPM and Chl-a (Table 4). The concentrations of 210Po in oysters by each region we found in this study indicated a similar trend with the average SPM in November and annual averages measured in the same region over 11 years (Figure 2). The average surface SPM amount measured in November, around the same time when the oyster samples were collected for this study, had a high correlation with the 210Po concentration (R2=0.89). The correlation between the 210Po concentration and the annual average SPM level was slightly weaker (R2=0.76) (Figure 3). The half-life of the metal substance contained in the Crassostrea gigas oysters is known to be 23 to 60 days [30]. This supports the conclusion that the November SPM records had a higher linear correlation with the 210Po concentration records from this study. On the other hand, the correlation between 210Po and the Chl-a concentration, which is an indirect indicator of plankton and contributes to the growth of oysters, suggests that the average Chl-a concentration in November (R2=0.62) and the average annual Chl-a concentration (R2=0.10) demonstrate a very low negative linear correlation. We also studied the relationship between the SPM level in the regions in November and the level of Chl-a per SPM unit concentration (Chl-a·SPM−1) to determine the quality of the substance matter. The SPM concentration mostly exhibited a negative linear correlation (R2=0.79) (Figure 4). We can therefore conclude that in the regions where the SPM concentrations were high, the contribution of the resuspension particles of sediment among all the suspended particles was greater than that of the phytoplankton. Research by Calvalho et al., (2011) also confirmed that the 210Po concentration in the edible parts of oysters has to do with the SPM level in the waters [13]. In addition, the concentration factor of the 210Po in the suspended sediment is known to be 2×10⁷, notably higher than that of the phytoplankton at 7×10⁴, and that of the zooplankton at 3×10⁴ [31]. Therefore, oysters inhabiting the regions where the resuspension particles of the sediments take up a large part of the suspended particles presumably accumulated a relatively higher amount of 210Po.
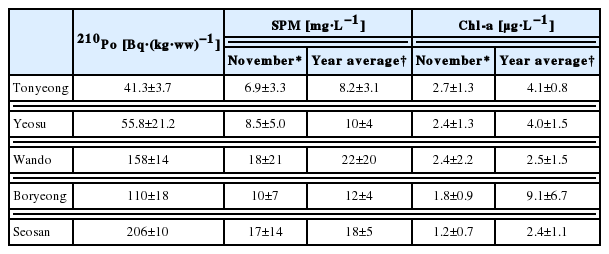
Activity Concentrations of 210Po in the Soft Tissue of Oysters and Concentrations of Suspended Particulate Matter in the Surface Water of Sampling Areas based on MEIS, 2003–2013
Activity concentrations of 210Po in the soft tissue of oysters and concentrations of suspended particulate matter in the surface water of the sampling areas observed in November and four seasons during 2003–2013 based on MEIS, 2003–2013.
Correlations between the activity concentrations of 210Po in the soft tissue of oyster and the concentrations of suspended particulate matter (SPM) in the surface water of the sampling areas observed in November where the oysters were collected and in four seasons during 2003–2013 based on MEIS, 2003–2013.
Correlations between the concentrations of suspended particulate matter (SPM) and the ratios of the concentrations of chlorophyll a to the suspended particulate matter Chl-a·SPM−1 (×10−3) in the surface water of sampling areas observed in November and four seasons during 2003–2013 based on MEIS, 2003–2013.
2. Calculation of the Amount of Intake
We calculated the annual effective dose of 210Po by eating oysters and mussels. The dose coefficient of 210Po by intake is 1.2×10⁻⁶ Sv·Bq−1 [32]. A typical Korean adult consumes 507 g·yr−1 and 117 g·yr−1 of oysters and mussels, respectively, in a year [33]. The annual effective dose (AED) was calculated with the following formula:
In this study, the values below were used to derive the AED of the oyster and mussel consumption of the Koreans. The dose coefficient of 1.2×10⁻⁶ Sv·Bq−1 was used as the CE210Po [32], and Ifood is the amount a Korean adult consumes in oysters and mussels on average annually. The 210Po concentrations of the two shellfish shown in Table 2 were used as C210Po.
We compared our results of the AED of 210Po from the oyster and mussel intake with previous studies. The AEDs of 210Po from the oyster and mussel intake in other nations fell in a wide range. The AED of 210Po in Korea at 21–104 μSv·y−1 was comparable with Taiwan’s 41 μSv·y−1 (Table 5) [27]. However, the AEDs of 210Po in France and India from oyster intake were 10.0–24.0 and 12.7 μSv·y−1 each, several times or up to ten times lower than that in Korea [21, 26]. The AED of 210Po in Korea by mussel intake was 5.01–5.46 μSv·y−1, generally lower than that of other countries at 5.1–4,332 μSv·y−1. Southern India and Slovenia had a similar minimum AED level as Korea, but Turkey showed an amount hundreds of times higher at 1,192–4,332 μSv·y−1 [22, 24, 25]. This seemed to represent the highest 210Po concentration in mussels found in this region.
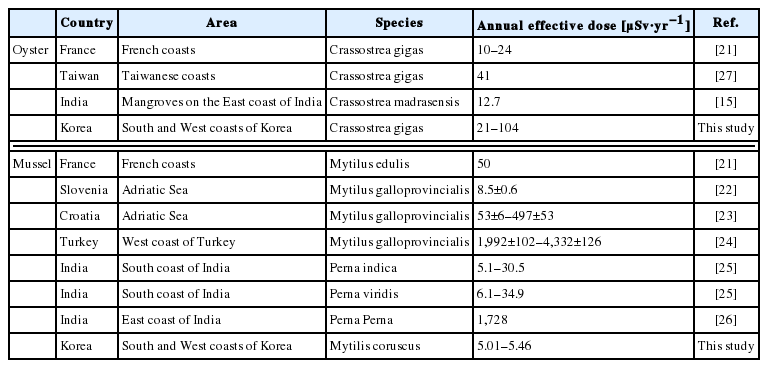
Comparison of the Annual Effective Doses of 210Po from the Ingestion of Mussels and Oysters in Other Countries with This Study
It has been reported that Korean adults’ AED of 210Po from food consumption was 269 μSv·y−1, and 80% of it was from seafood intake [10]. The average AED of 210Po calculated by the amount of annual consumption of oysters and mussels was 76±42 (average±standard deviation) μSv·y−1. The AED of 210Po from oyster and mussel intake for Korean adults was approximately 28±16% of that from total food intake, and approximately 35±19% of that was from total seafood intake. Oysters and mussels accounted for around 3% of total seafood consumption among Korean adults [33], but the AED of 210Po from oyster and mussel intake accounted for a disproportionally high amount compared to that from total food intake.
Conclusion
The ranges of 210Po concentration contained in oysters and mussels grown in Korean farms were 41.3±3.7 to 206±10 Bq·(kg-ww)−1 and 42.9±3.2 to 46.7±0.7 Bq·(kg-ww)−1, respectively. The oysters grown in the Western coast contained two to five times as much 210Po as their counterparts found in the Southern coast. The concentration had a positive linear correlation (R2=0.89) with the SPM concentration of the surface water in November, around the same time when the samples for the study were collected. This indicates that the 210Po accumulated on the edible parts of oysters is highly affected by the concentration of the resuspension particles from sediments (inorganic suspended particles).
The AED of 210Po from oyster or mussel intake in Korea was estimated to be 5.01–104 μSv·yr−1. The AED of 210Po from eating oyster in Korea was 21–104 μSv·y−1, relatively higher than of Taiwan, France, and India. The AED of 210Po in Korea by mussel intake was 5.01–5.46 μSv·y−1, indicating that oyster intake was several times to 20 times more responsible for the AED of 210Po in Korea. The AED of 210Po from mussels in Korea was equivalent to the minimum level in Southern India and Slovenia. On the other hand, Eastern India and Turkey had a figure hundreds of times higher than that of the AED of 210Po from mussels than the results of this study. The average AED of 210Po calculated by the amount of annual consumption of oysters and mussels was 76±42 μSv·y−1, and compared to previous studies, it was approximately 28±16% of that from total food intake, and approximately 35±19% of that from total seafood intake. This is a rather high portion considering that oysters and mussels account for only around 3% of total seafood consumption among Korean adults. The concentration of 210Po within seafood consumed by Koreans may differ according to the region from which they were collected and the type of seafood that is consumed, just as it showed different results among different regions. There is therefore a need to evaluate the AED of 210Po to reflect the different types of seafood produced and consumed in different regions of the Korea.
Acknowledgements
This research was conducted with support by the Korea Institute of Ocean Science & Technology “A study on the dispersion of radioactive materials and their influence on marine biota following the accidental release to the ocean” (PE99403).