

Introduction
Fukushima Medical University (FMU) is located in the northeastern region of Japan and is 57 km northwest of the Fukushima Daiichi Nuclear Power Plant. The Tohoku region Pacific Coast earthquake occurred on March 11, 2011. Fukushima Daiichi Nuclear Power Plant accidents broke out subsequently. A previous study in our laboratory had been conducting research on environmental radiation and radon (Rn) [1, 2]. As a part of the study, measurements of gamma radiation in the air with a sodium iodide (NaI) scintillation counter installed at the center of the laboratory were conducted since September 2010. The trends in gamma radiation measurements in the air, from the beginning of the accident until August of the same year, were reported [3]. This paper described that gamma radiation showed the most drastic change, i.e., peak value of 9.3 times the usual level occurred on March 16, and exponentially decreased to 1.5 times the usual level after 5 months. Furthermore, from these measurements, it was possible to estimate the short and long half-lives of the radioactive isotopes released by the accident. The measurement was continued until March 2015 by the previous researcher, and then the experiment was taken over to the next one.
The present study mainly reports the measurement results after September 2011. As a result of conducting measurements over a long period of time, it became evident that short and long half-lives were gradually changing. Measurements to assess radiation levels outside of the building were conducted from July 2012 using new equipment placed near the window. In these measurements, it was found that in the early stages, radiation from radioactive isotopes with short half-lives was dominant, while radiation from radioactive isotopes with longer half-lives became dominant as the measurement period became longer. In addition, the effects of snowfall and decontamination work on radioactive materials were also observed in these measurements. As a stuff of FMU, which is close to the site of the nuclear accident and a central institution for medical care in Fukushima Prefecture, we believe it has a responsibility to provide objective knowledge on environmental radiation. The author regularly disseminates information through a website (https://www.fmu.ac.jp/home/physics/ro/NaIEMF.htm). In addition, based on these measurements, the present author considered the possibility of predicting trends in environmental radiation and attempted to do so.
Materials and Methods
1. Measurement Location
FMU is located in the northeastern region of Japan (37°45′N, 140°28′E), at an altitude of 67.4 m above sea level, and is 57 km away from the northwest of the Fukushima Daiichi Nuclear Power Plant. Fig. 1 presents the relative position between FMU and the Fukushima Daiichi Nuclear Power Plant. Measurements were taken at two spots in a room on the 4th floor of the five-story concrete building of FMU built in 1988. The two measurement spots are at the center of the room and by the window. The former one is located about 5 m away from the window and is a place where FMU staff typically carry out their activities (Fig. 2). The latter one faces the window and is 7 cm away from it (Fig. 3).
2. Exp 1: Measurement at the Center of the Room
A diameter of 76 mm and a length of 76 mm thallium-doped sodium iodide (NaI[Tl]) scintillation detector (S-1211-T, energy resolution of the detector in terms of FWHM is 7% for 137Cs; Teledyne Brown Engineering Environmental Services) observed gamma radiation in air from September 2010 to April 2020 (Fig. 2). Every 4-hour period, data were stored in a personal computer. The present report discusses only the gross counting rate expressed as a unit of counts per second (cps).
3. Exp 2: Measurement by the Window
A diameter of 76 mm and a length of 76 mm NaI(Tl) scintillation detector (EMF211, energy resolution of the detector in terms of FWHM is 10% for 137Cs; EMF Japan Co. Ltd.) and digital processor (GAMMA-RAD5; Amptek Inc.) observed gamma radiation in the air from July 2012 to March 2023 (Fig. 3). Every hour, counting data was stored in a personal computer. Average values were calculated every 24 hours. The present report discusses mainly dose rate, expressed as a unit of nSv/hr. This series of measurements was interrupted due to equipment failure from July 9, 2015, to November 4, 2015.
Results and Discussion
1. Exp 1: Measurement at the Center of the Room
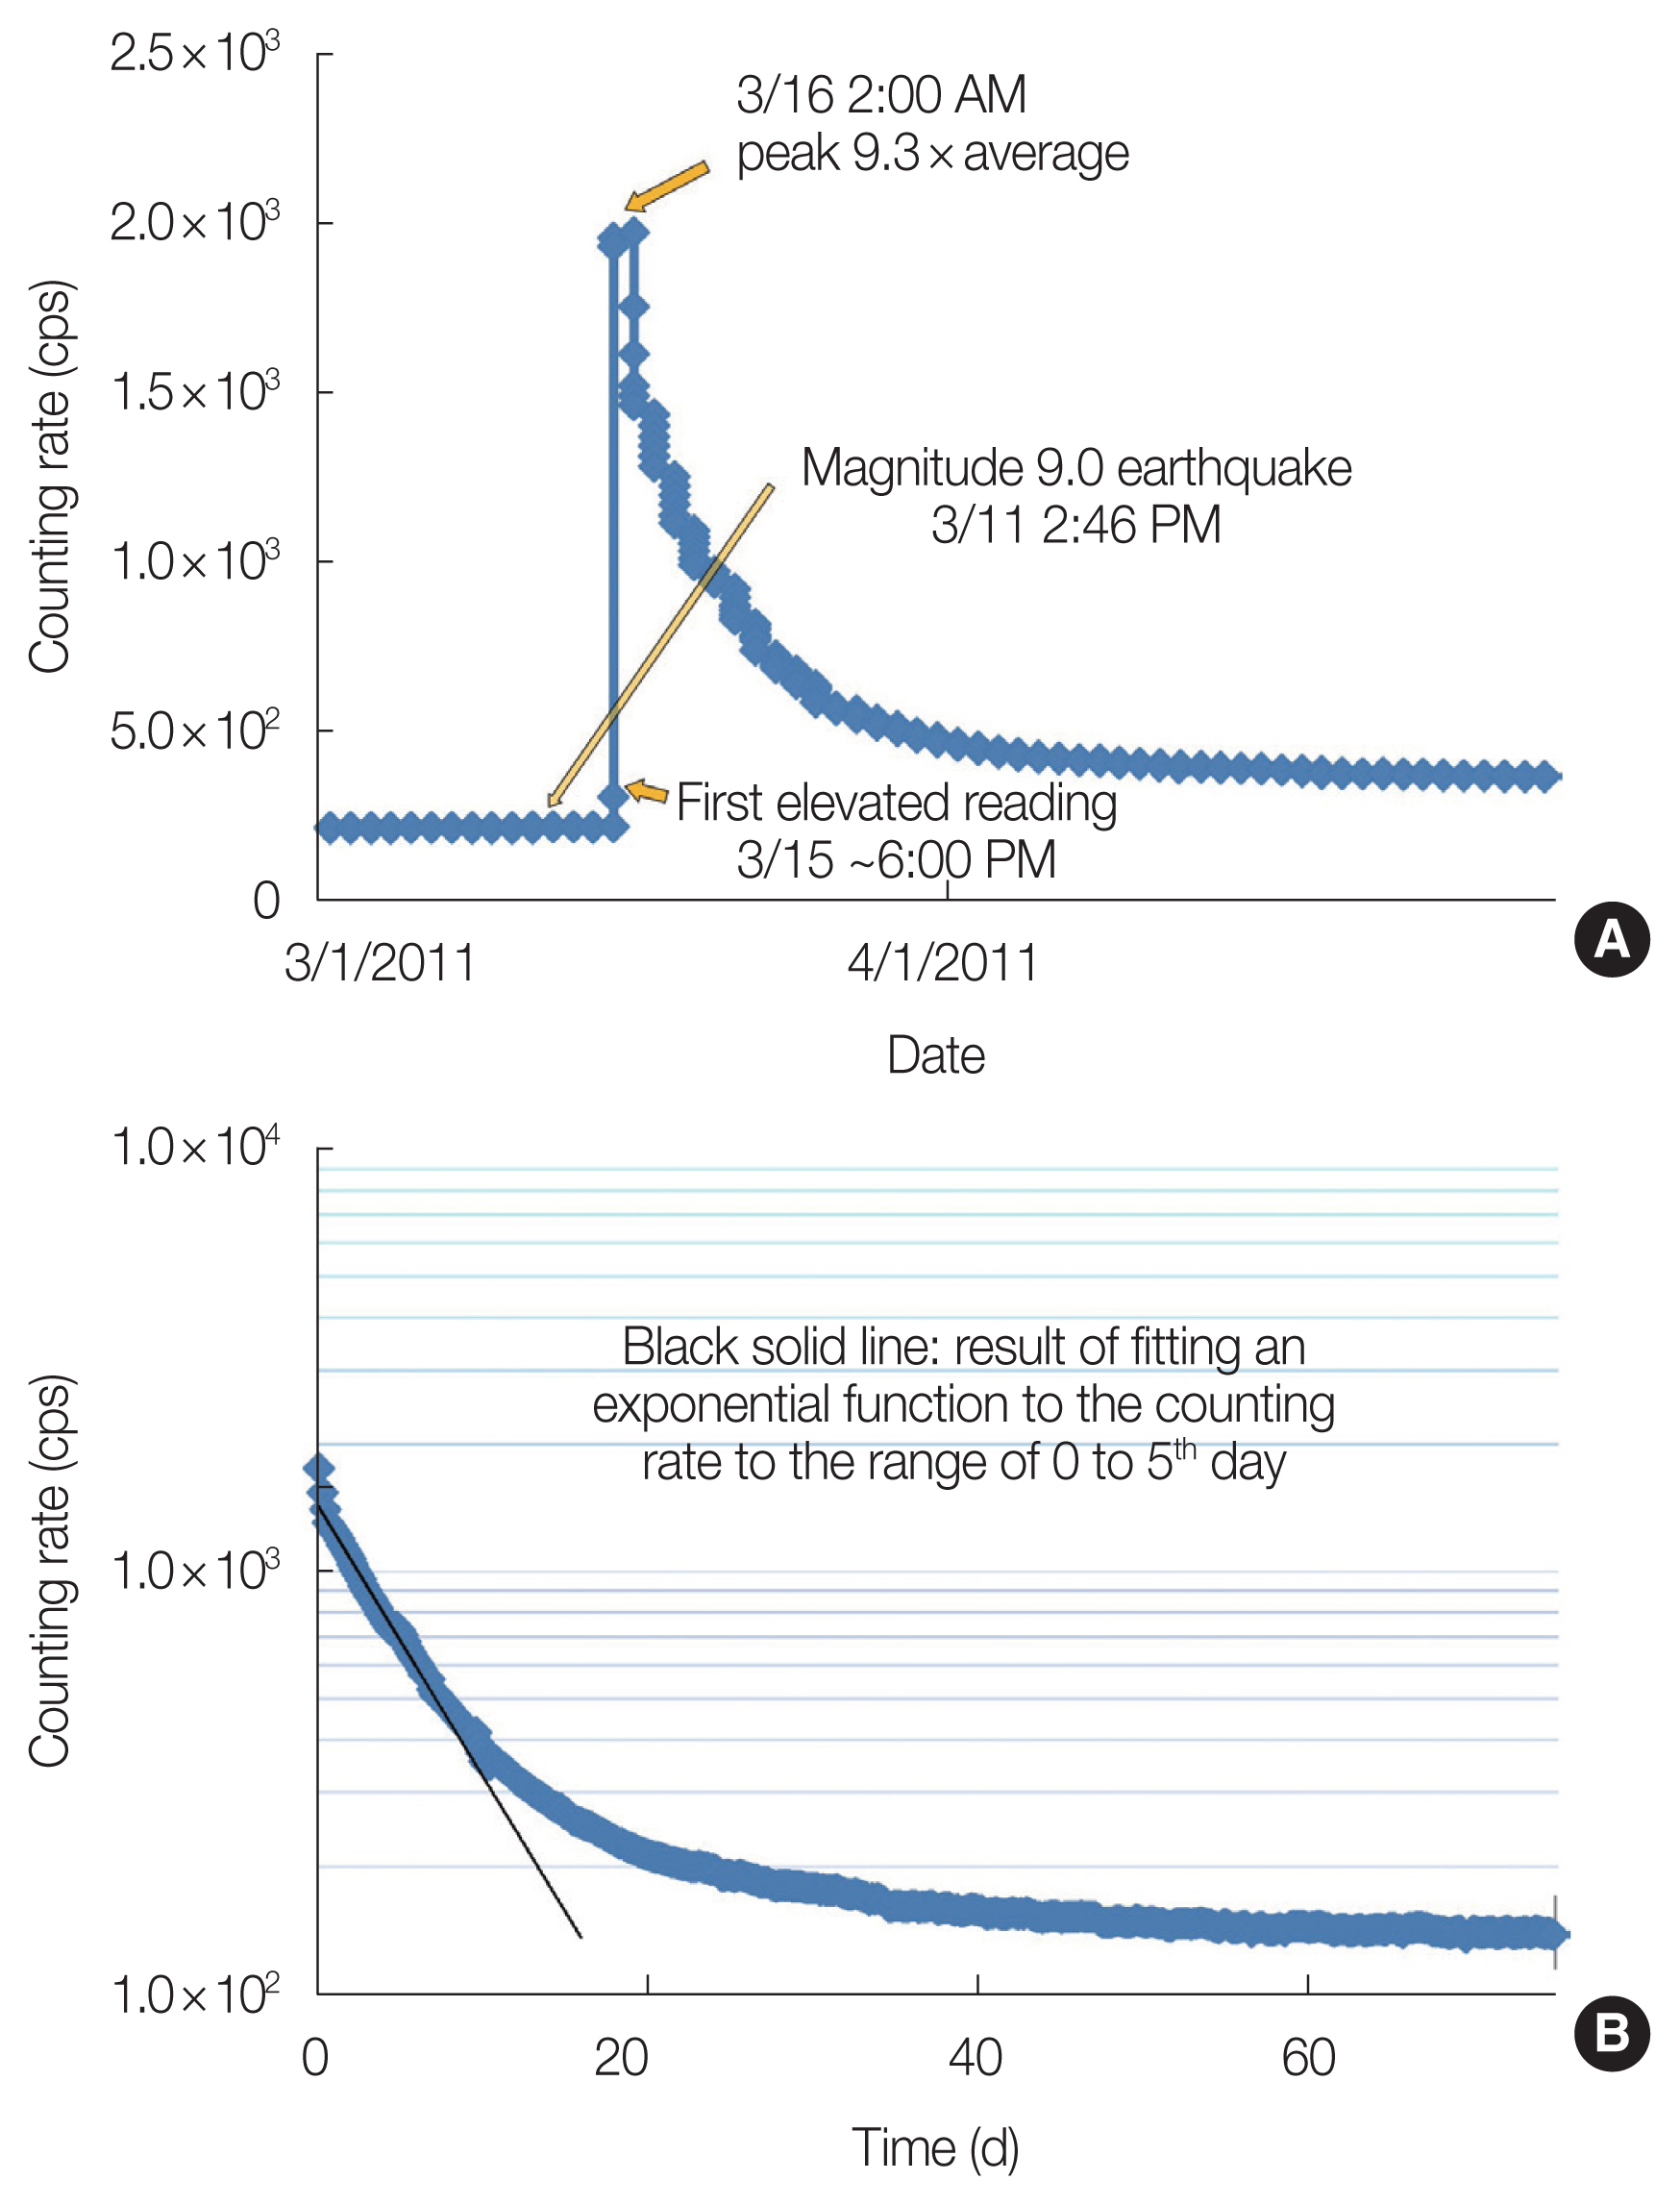
Fig. 4A presents serial gamma radiation measurements in air with a NaI scintillation counter (S-1211-T) located about 5 m away from the window in a room on the 4th floor of the five-story concrete building of FMU for the period from March 1 to April 30, 2011. There was no change in counts at the time of the earthquake on March 11 at 2:46 PM, but a sudden increase in counts was observed around 6:00 PM on March 15 and the radiation dose reading reached the maximum value of 9.3 times the usual values. Afterward, the counts appeared to decrease exponentially, and the half-life was roughly estimated to be about 3 days. After 1 month had passed, the semi-log plot of the counting rate versus time did not fit to a single line. It was considered that this was due to the addition of counts from the long-term half-life. A detailed discussion of the measurements up to August 2011, including the information mentioned above, is presented in reference [3]. Afterward, the measurements were continued until April 2020, when the equipment’s aging required an interruption, for the first 3 years by Kobayashi, and for the following 8 years by the present author.
As a result of continued measurements over a long period of time, the following findings have become evident. While the counts appeared to decrease exponentially for several days after March 15 at 6:00 PM, the semi-log plot of the counting rate versus time did not fit to a single line when observed over a period of several months. Fig. 4B presents serial gamma radiation counting rate on a logarithmic scale for a period of 70 days from the day when the counting rate reached its maximum. The horizontal axis represents the number of days from the day with the maximum counting rate. The counting rate is plotted by subtracting the average value before the nuclear accident, which is 212.558±0.027 cps. The black solid line represents the result of fitting an exponential function to the counting rate to the range of 0 to the 5th day. The counting rate during the first 5 days is mainly dominated by radiation from radioactive isotopes with a short half-life, while after the 5th day, radiation from radioactive isotopes with longer half-lives is considered to be dominant.
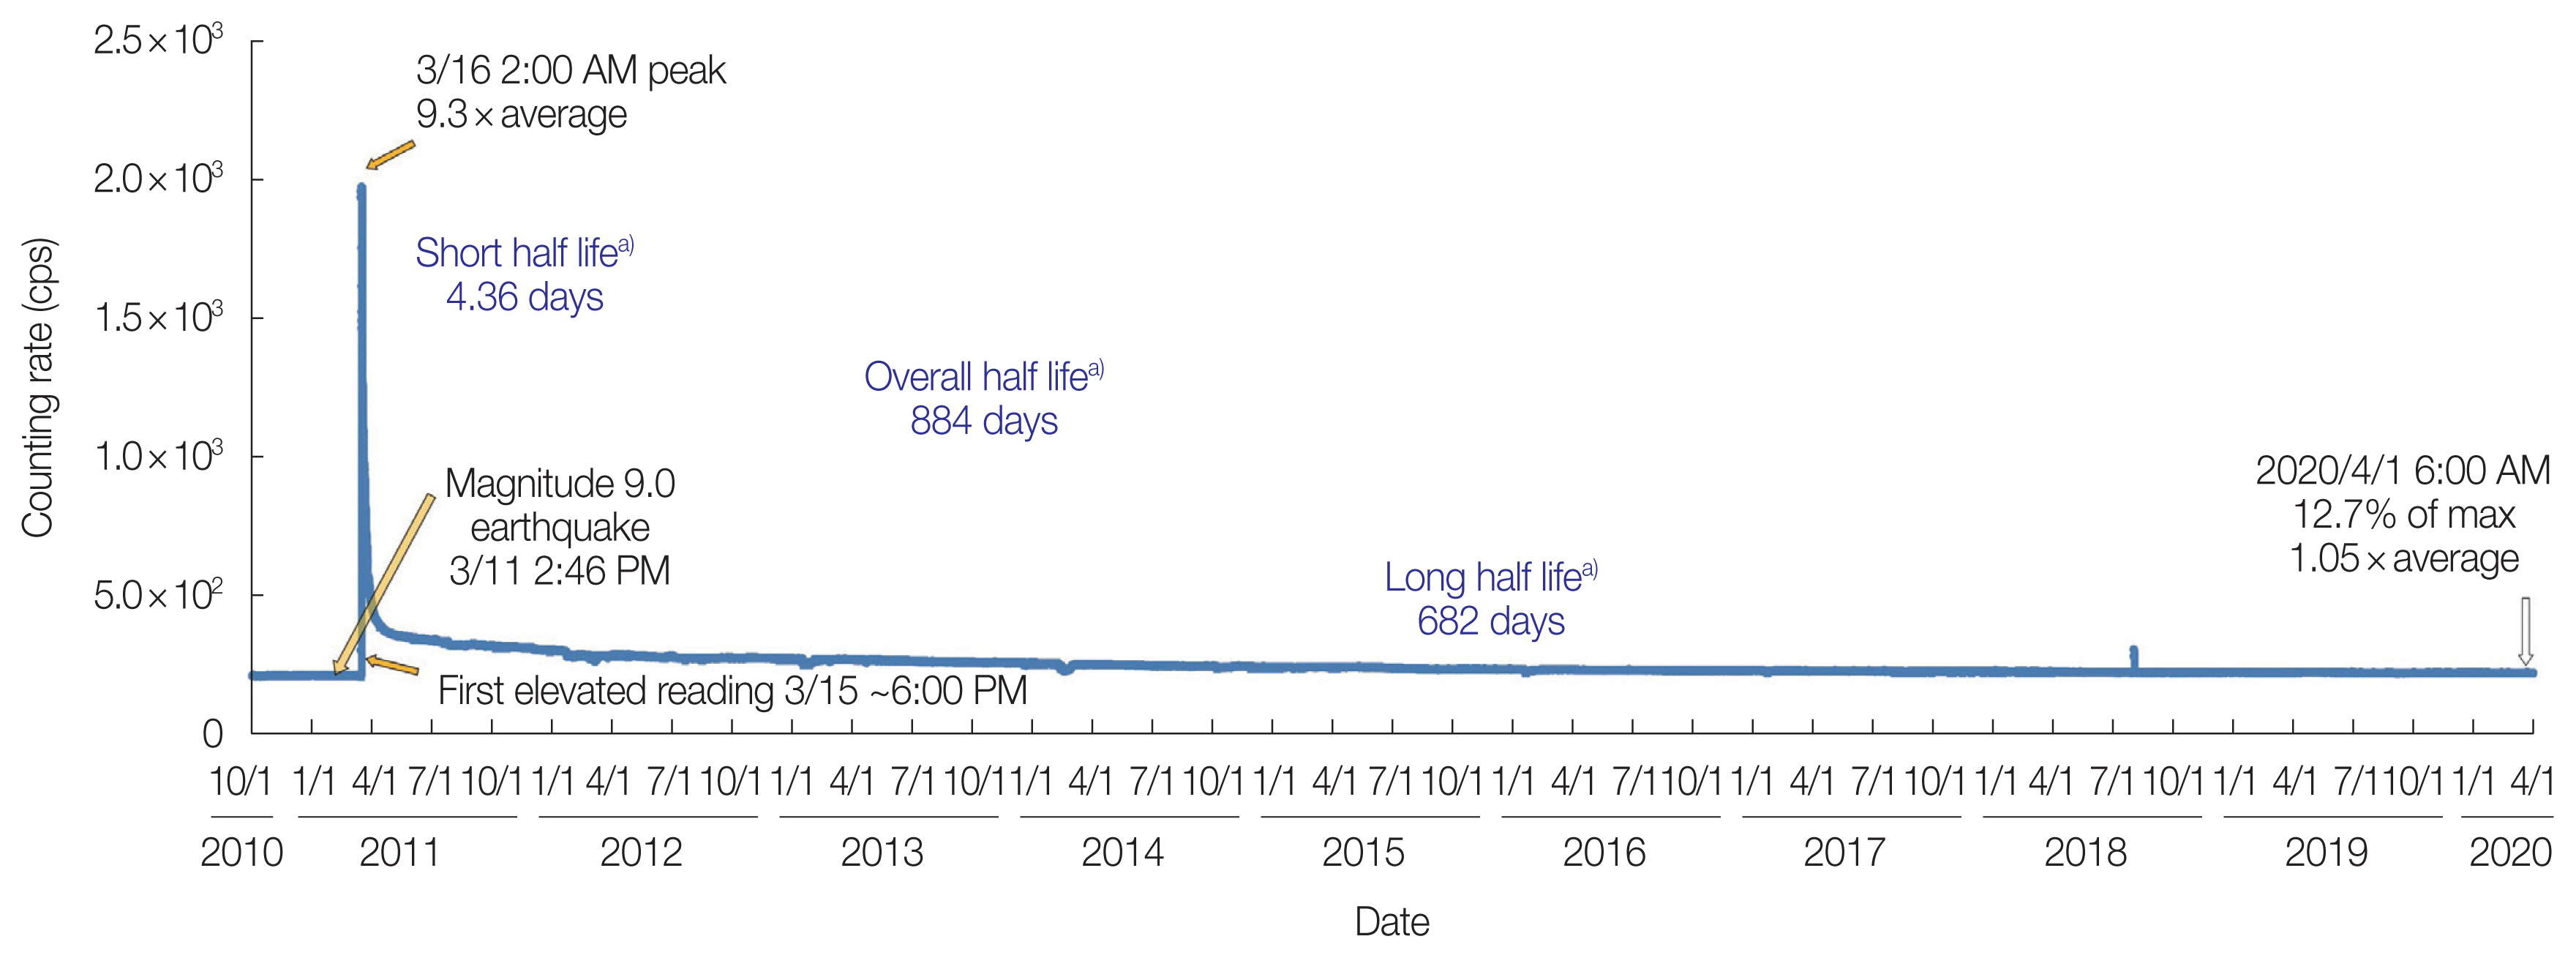
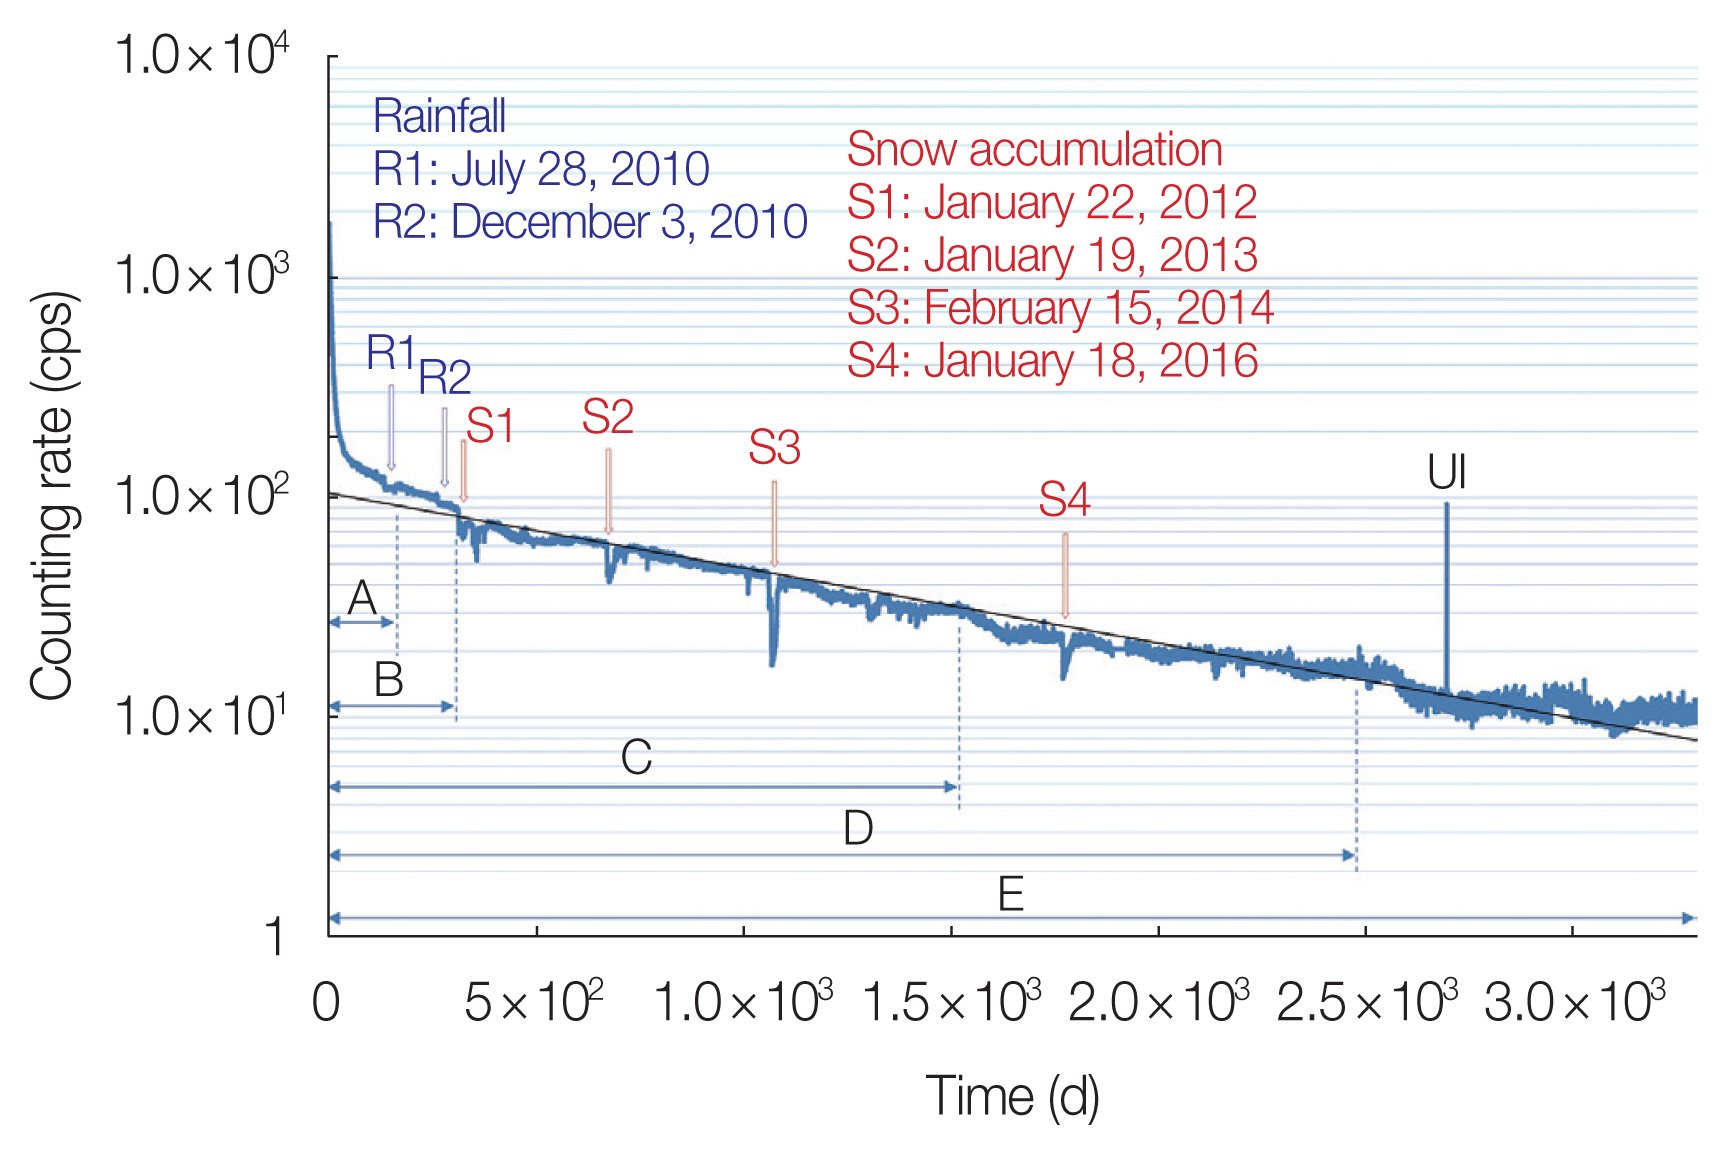
Fig. 5 presents serial gamma radiation measurements in air with a NaI scintillation counter (S-1211-T) for the period from September 2010 to April 2020. Fig. 6 shows the counting rate of measurements in Fig. 5 on a logarithmic scale for a period of 3,304 days from the day when the counting rate reached its maximum. The counting rate is plotted by subtracting the average value before the nuclear accident, which is 212.558±0.027 cps. For reference, the result of fitting an exponential function by the least squares method to the entire range of days is shown as a black solid line. The counting rate and the fitting line seem to be in good agreement from around 330 to 2,500 days. The counting rate shows a different trend during the initial period of about 300 days and after the 2,500th day. Let the half-life of this exponential function be Tall. Assuming that the total counting rate is exponentially decreasing, the counting rate C is calculated based on the following formula:
where t is days from the day when the counting rate reached its maximum, and the constant c represents the value of the counting rate at the day when the counting rate reached its maximum. Tall was obtained by fitting Equation (1) to the counting rate after subtracting the pre-accident average value of 212.558±0.027 cps using the least squares method.
The temporal change of the counting rate is considered to be due to the measurement of radiation from all radioactive isotopes with different half-lives. However, for simplicity, one model which is based on the sum of radiation from one radioactive element with a short half-live and one with a long half-live, could be assumed. Assuming that the counting rate C′ is represented by the following Equation (2):
where t is days from the day when the counting rate reached its maximum, Ta and Tb are the short half-live and long half-live, respectively. Constants a and b represent the intensities of the counting rates from radioactive isotopes with short and long half-lives, respectively. Nonlinear least squares regression, using a command of S-PLUS [4], obtained values of Ta, Tb, a, and b for several time periods (period A–E indicated in Fig. 6). Table 1 shows Ta, Tb, a, b, and Tall of each time period. Since these are results from simplified model calculations, it is difficult to ascertain the radioactive isotopes from which these half-lives originate. However, a discussion regarding the derivation of the prolonged half-life from Cs will be engaged in the subsequent chapter. It would be possible to make rough discussions and predict whether similar decreases will occur in the future based on these data. As time periods, which is the number of days from the day with the maximum counting rate, increased, it was found that both the short half-lives Ta and long half-lives Tb, as well as the overall half-lives Tall, increased. The values of the short half-lives Ta were obtained to be in the range of 3.63 to 4.36 days. These values are close to the 8-day half-life of 131I, which is considered to be one of the radioactive isotopes leaked from the nuclear plant. The physical half-life of 131I is 8 days, but it is consistent to assume that the environmental half-life has been shortened by factors such as rain. The values of the long half-lives Tb were obtained to be in the range of 181 to 683 days. Among the radioactive isotopes that are considered to have leaked out from the nuclear plant, 134Cs with a half-life of 2.1 years and 137Cs with a half-life of 30 years are likely to have values similar to Tb. Tall also tended to increase as the measurement period increased and was larger than Tb for each period. As the measurement period gets longer, the influence of radioactive isotopes with longer half-lives becomes more significant. The proportions of constants a and b, which represent the intensities of counting rates from radioactive isotopes with short and long half-lives, were calculated (Table 1). The initial values were 87% for a and 13% for b, but they gradually saturated to 91% for a and 9% for b as the period got longer. These results suggest that 131I is more easily removed in the natural environment compared to 134Cs and 137Cs. As shown in Fig. 6, while the counting rate and the fitting line seem to be in good agreement from around 330 to 2,500 days, the counting rate shows a different trend during the initial period of about 300 days, and after the 2,500th day. It may be considered that radioactive isotopes with a half-life of Ta dominate in the region of time period A or B, and radioactive isotopes with a half-life of Tb dominate in the region from time period C to D. The former is considered likely to be 131I with a half-life of 8 days and the latter 134Cs with a half-life of 2.1 years. It is possible that the influence of 137Cs with a half-life of 30 years is dominant in the region after time period D. Comparing, for example, the value of Ta during period A (3.63 days) with the half-life of 131I, and the value of Tb during period E (647 days) with the half-life of 134Cs, it can be said that this inference is consistent.
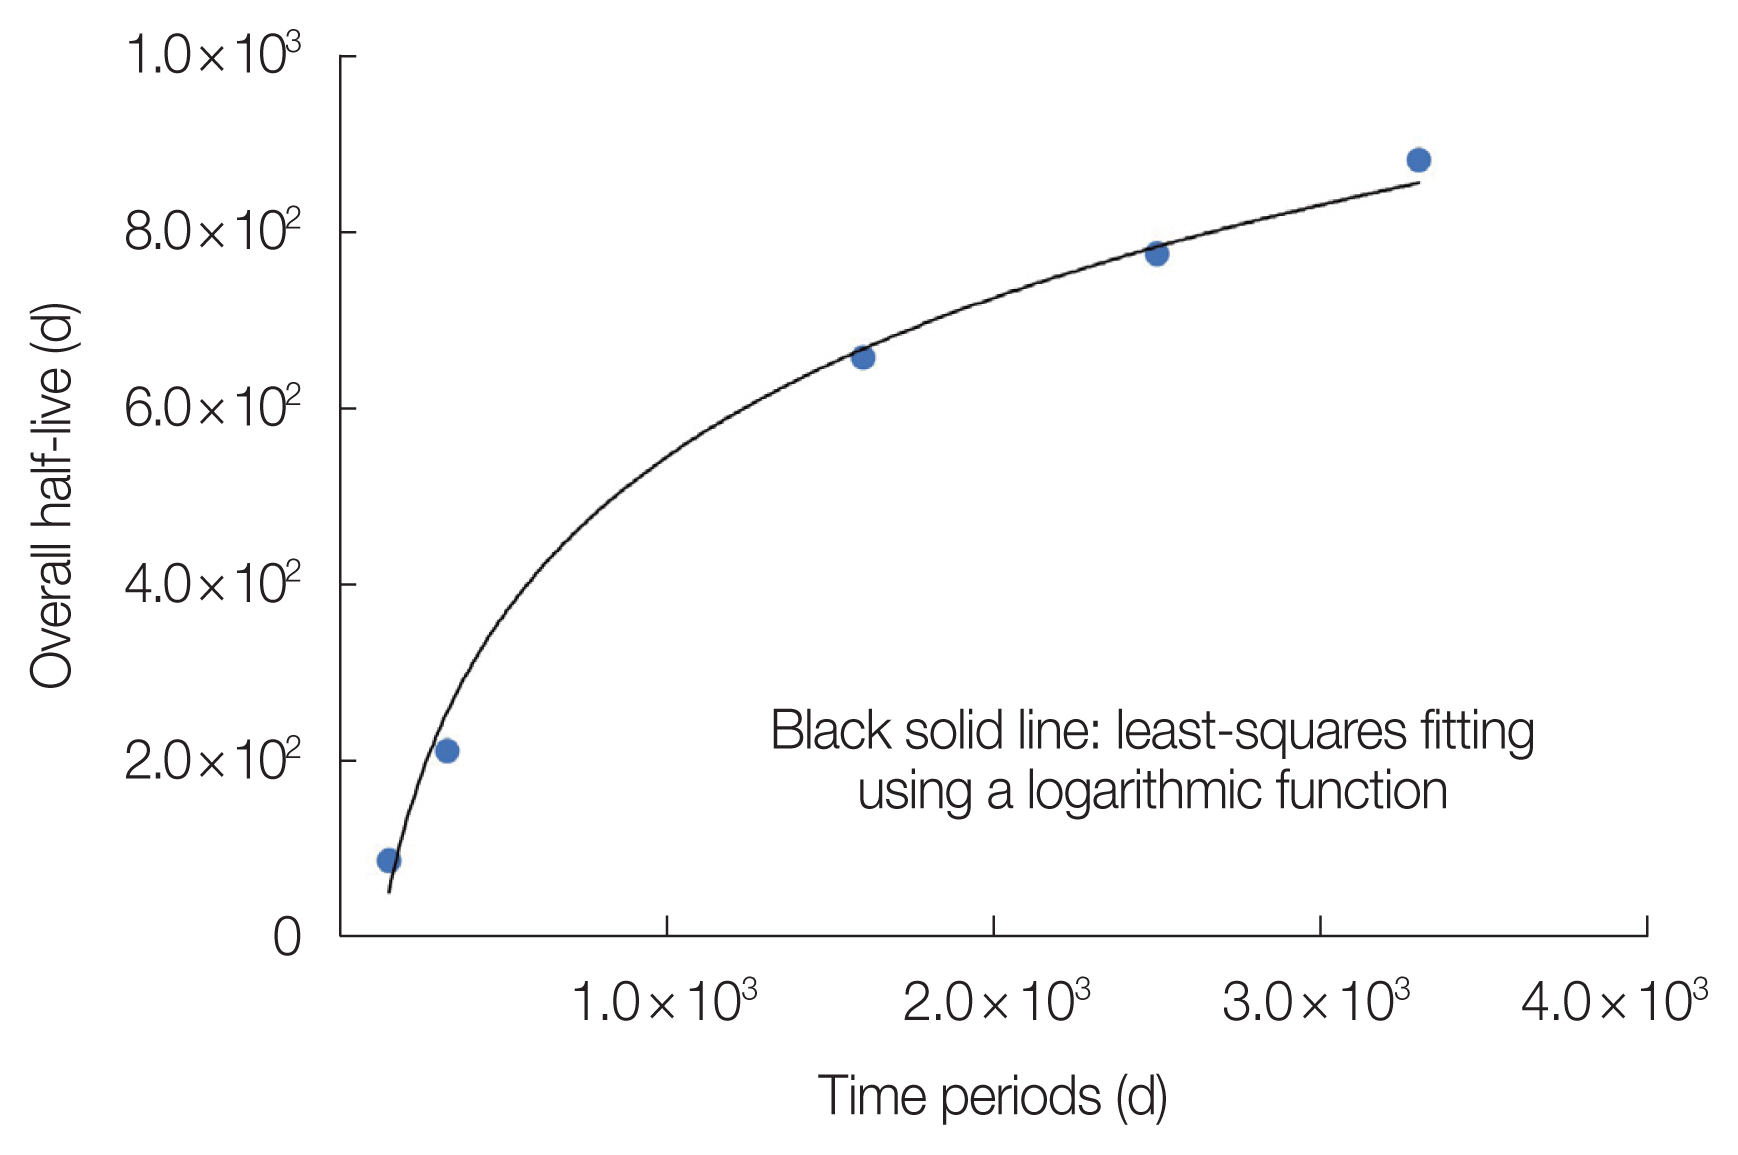
Tall increases as the time period lengthens, and its value as of time period E is 884 days. If Tall remains constant for the time period E, then the counting rate is expected to be 1.021 times the pre-accident level after 4,000 days from March 16, 2011, and 1.0097 times after 5,000 days. Fig. 7 presents the dependency of the overall half-live Tall on the time periods. The results of the least squares fitting using a logarithmic function revealed that Tall behaves logarithmically with respect to the time periods. The fitted equation is shown below:
where p is the time periods in unit of day. Assuming that the Equation (3) continues to hold in the future, Tall would be 1,065.8 days 20 years after March 16, 2011, and 1,171.6 days 30 years after that date. Therefore, the predicted decrease in radiation based on the assumption that Tall remains constant is expected to be revised upward.
2. Exp 2: Measurement by the Window
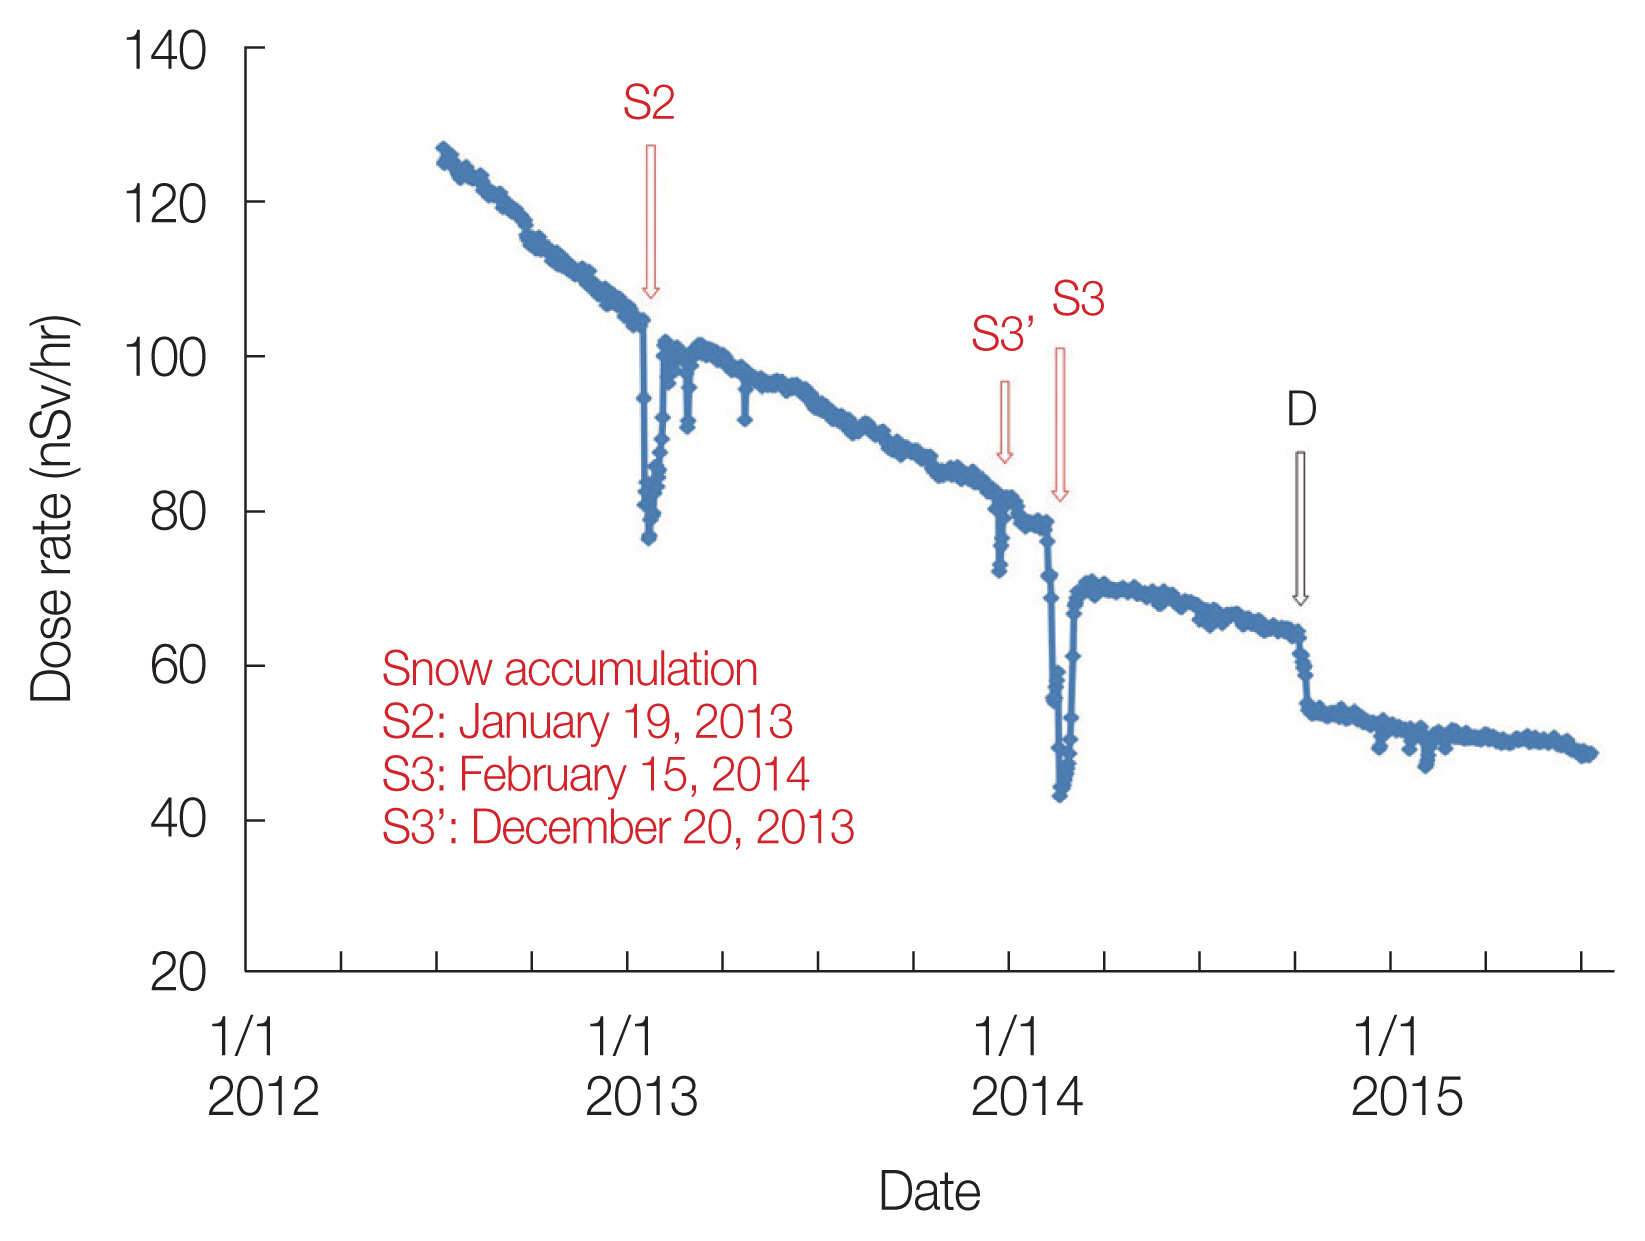
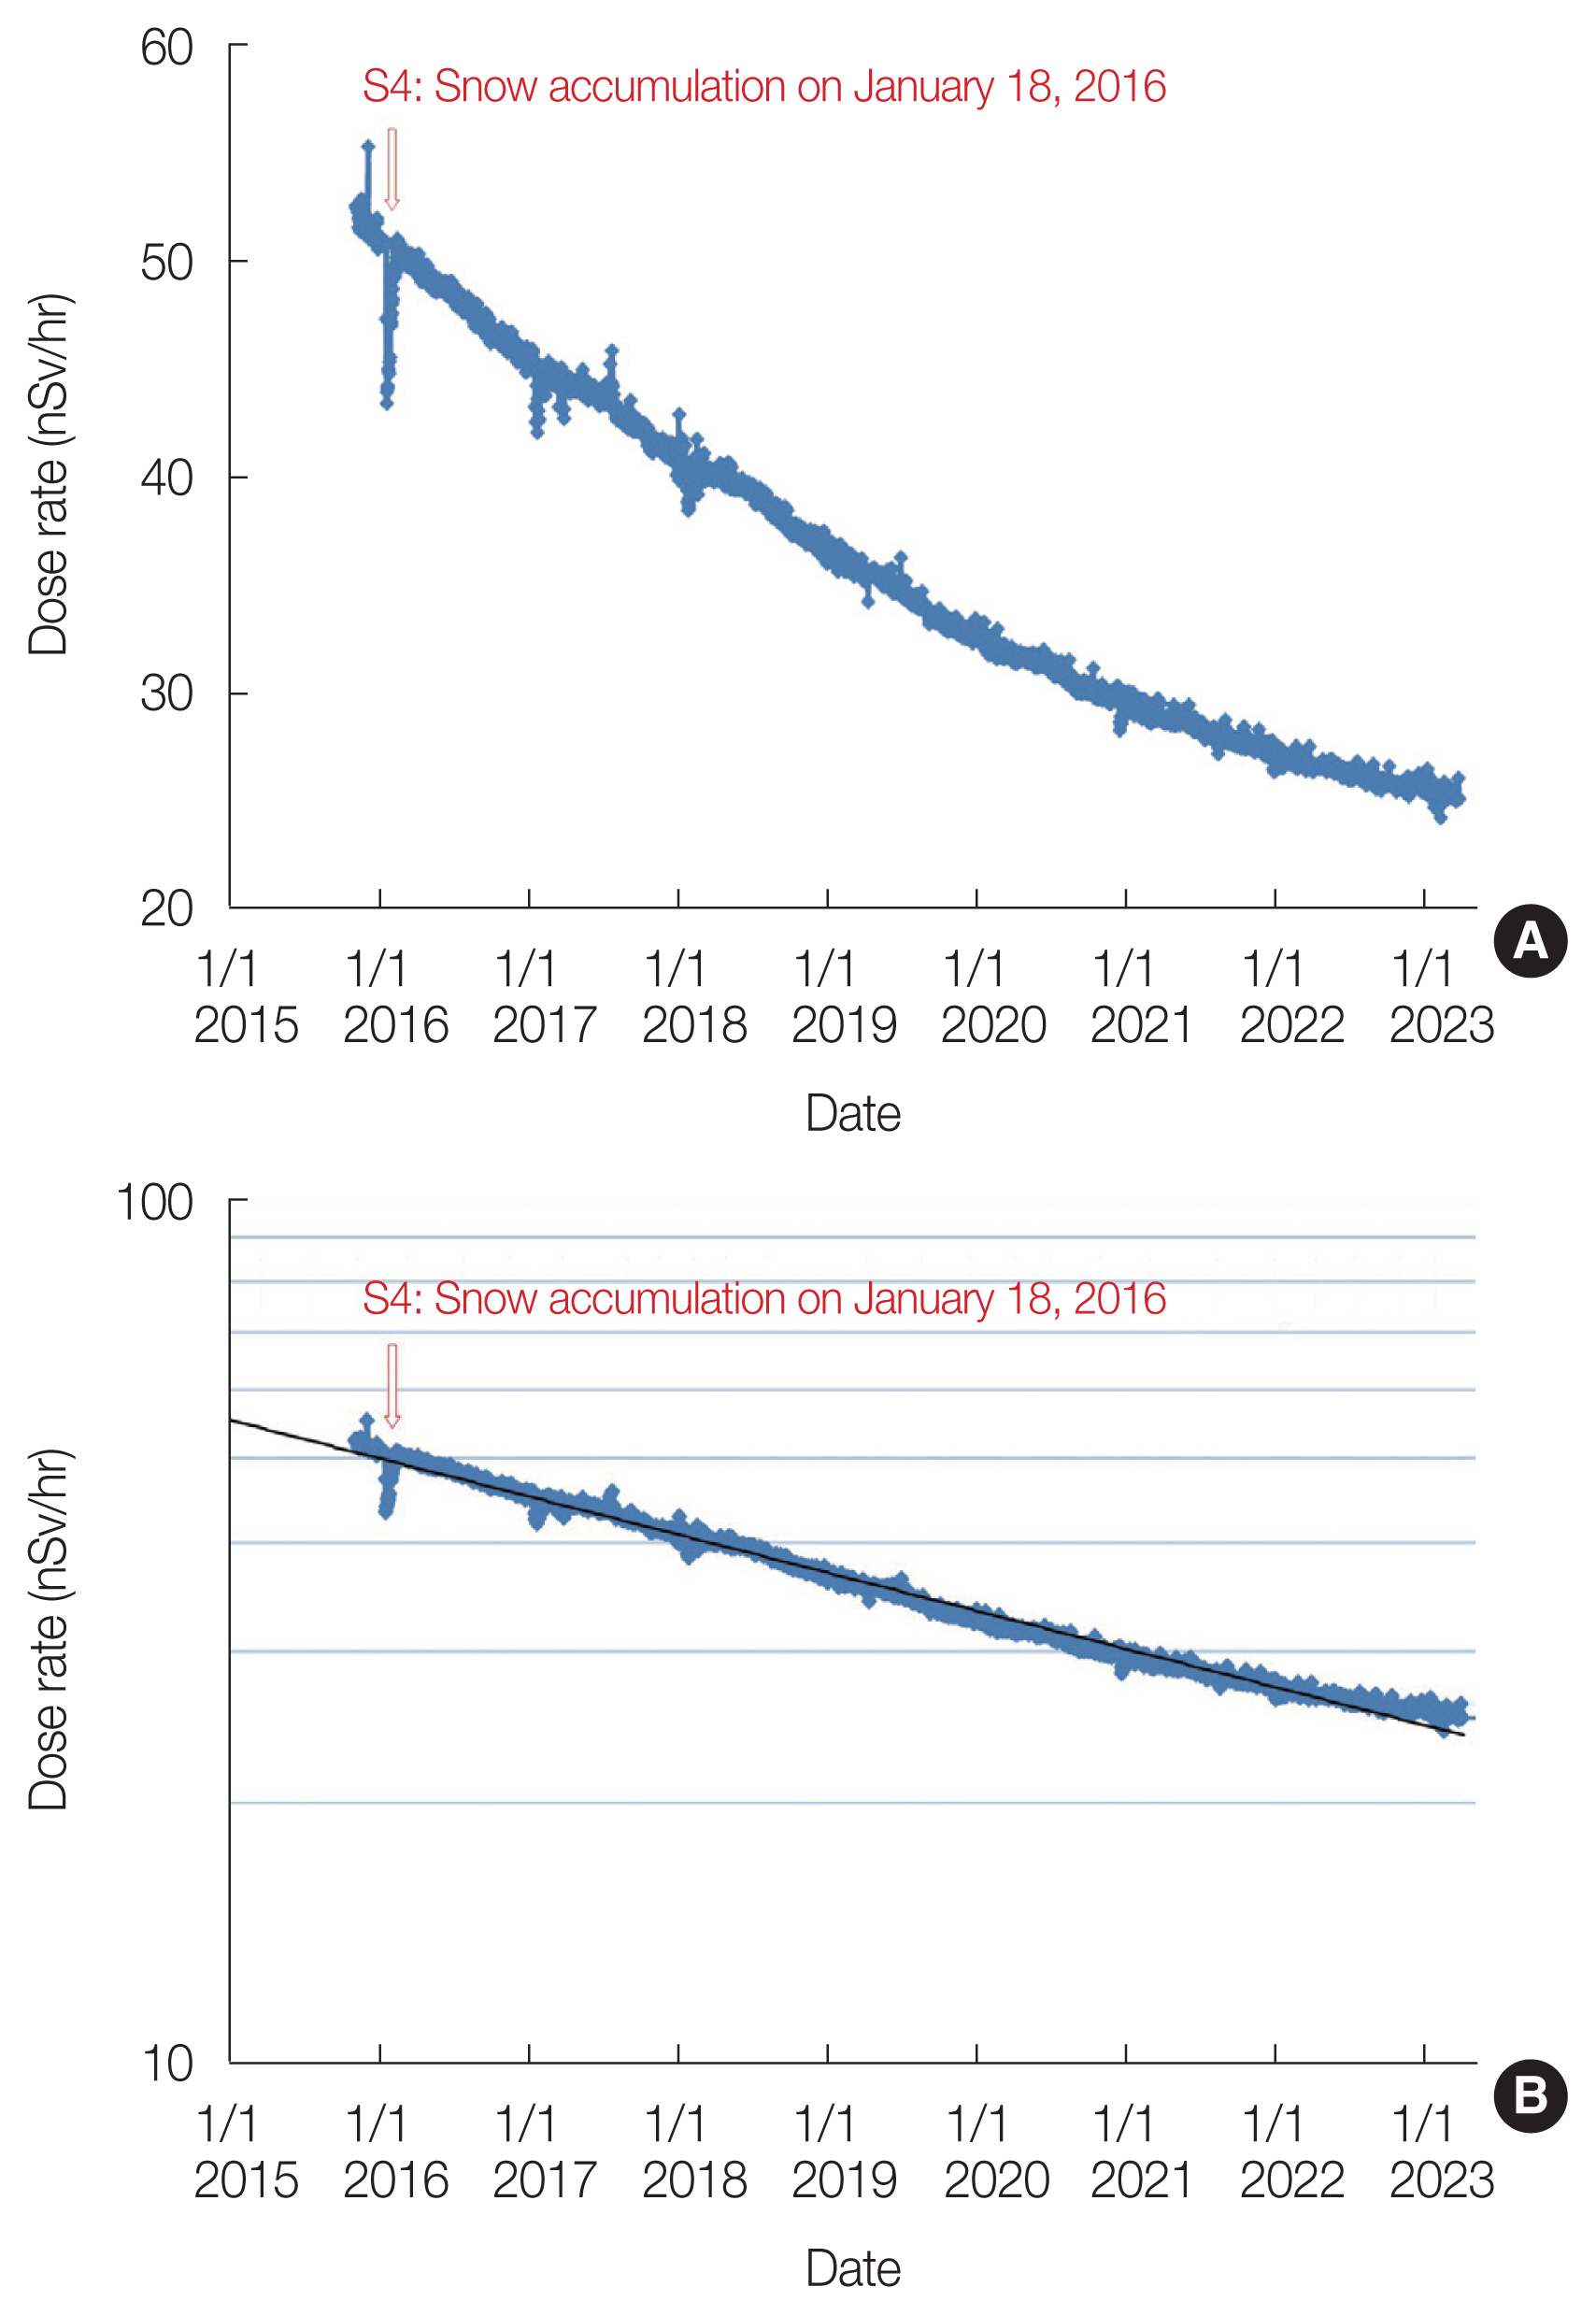
We had only a pocket dosimeter (ZP-145; Panasonic) to measure the radiation dose rate as a unit of Sv/hr in our laboratory when the nuclear accident occurred. We introduced a new equipment (EMF211, GAMMA-RAD5, energy resolution of the detector in terms of FWHM is 10% for 137Cs) that could measure radiation dose rate accurately as a unit of Sv/hr in July 2012. The Teledyne S-1211-T was measured in the center of the room where staff were usually active, so the new equipment was set to measure facing outdoors near the window. Fig. 8 presents serial gamma radiation dose rate measurements in air with EMF211 and GAMMA-RAD5 for the period from July 7, 2012, to July 8, 2015. The equipment is facing the window and is 7 cm away from it in a room on the 4th floor of the five-story concrete building at FMU. The radiation dose rate exhibited exponential behavior, decreasing from 127.0 to 47.9 nSv/hr over a period of 3 years. Fig. 9A presents serial gamma radiation dose rate measurements for the period from November 5, 2015, to March 31, 2023. The equipment malfunctioned in July 2015, and repairs and calibration were conducted. Measurements resumed in November 2015. Therefore, the continuity of the dose rate between the two periods is not guaranteed. Fig. 9B presents serial gamma radiation dose rate measurements on a logarithmic scale for the same period. For reference, the result of fitting an exponential function is shown as a black solid line. This fitting was conducted for the dose rate, including the natural background radiation, and the apparent half-life is 6.5 years. Assuming that the decreasing pace of this approximation curve continues, the dose rate is predicted to be 21.11 nSv/hr on March 11, 2024, 18.98 nSv/hr on March 11, 2025, and 17.06 nSv/hr on March 11, 2026. Since 2021, there seems to be a tendency for the dose rate to show values greater than the approximation curve, so the rate of decrease may be slower than this prediction. At least, calculating the annual dose simply from the predicted dose rate of 21.11 nSv/hr on March 11, 2024, yields 185 μSv, which is sufficiently low to maintain a normal lifestyle.
To bolster the discussion on the radioactive isotopes associated with the long and short half-lives from the previous chapter, on July 2, 2012, Kobayashi from the same research laboratory conducted a comparative measurement using EMF211 and GAMMA-RAD5 [5]. These measurements were carried out in the center of the room and by the window. The dose rates in the center of the room and by the window were 0.068 and 0.126 μSv/hr, respectively. In the spectrum, while only slight peaks of 134Cs (i.e., 605 keV and 796 keV) were observed in the center of the room, these peaks were distinctly observed by the window. The 137Cs (662 keV) peak was scarcely observed in the center of the room, whereas it was prominently observed by the window. The 131I peak (i.e., 364 keV) was not clearly observed in either location. These results appear to reinforce the argument made in the previous chapter that the radioactive element with a longer half-life is likely to be Cs.
3. Comparison of the Two Measurements
While measurements in the center of the room are shielded by the walls of the reinforced concrete building, measurements by the window are shielded only by a single window glass pane. A comparison of gross counting rates was conducted for two instances: on July 12, 2012, during the initial installation of the detector (i.e., EMF211), and on September 11, 2019, which marked the last day measurements were possible using the detector (i.e., Teledyne S-1211-T). In both cases, the gross counting rates were calculated for a duration of 4 hours, from 2:00 AM to 6:00 AM. In the measurements on July 12, 2012, the gross counting rates in the center of the room and by the window were 490.25 and 746.01 cps, respectively. Additionally, in the measurements on September 11, 2019, the gross counting rates in the center of the room and by the window were 222.67 and 301.50 cps, respectively. The ratio of the gross counting rate by the window to the gross counting rate in the center of the room is 1.52 for the former and 1.35 for the latter. It can be observed that the central area experiences a greater reduction rate in counting rates compared to the area near the window.
4. Influence of Rainfall, Snow Accumulation and Decontamination Work
Both measurements were observed to be affected by factors such as snow accumulation. In Fig. 6, the marks (R1 and R2) indicate the points where the counting rate temporarily decreased due to rainfall, while the marks (S1–S4) indicate the points where the counting rate temporarily decreased due to snow accumulation. At the point of the rainfall shown in R2, the counting rate appears to have slightly decreased after the rainfall compared with that before. Regarding the rainfall shown in R1, the temporary decrease lasted for approximately 48 days, and the rate of decrease in the counting rate per unit time appeared to be the same before and after the rainfall. The present author had anticipated that radioactive materials would be washed away by the rainfall, leading to a decrease in environmental radiation, but no significant decrease was observed. Furthermore, the present author did not anticipate that it would take 48 days for the counting rate to return to its pre-rainfall level after the temporary decrease caused by the rainfall. Generally, it is said that when it rains, Rn daughter nuclides in the air settle on the ground, causing a temporary increase in environmental radiation levels. However, points showing the opposite trend marked as R1 or R2 are only observed during periods close to the nuclear accident. During this period, it is speculated that the dominant influence could be the shielding effect caused by the wetting of the soil due to nuclear species from the nuclear accident, rather than the influence of Rn daughter nuclides. The causes of the shielding effect due to wet soil are believed to include the transportation of nuclear species that were on the soil surface into the soil interior as a result of rainfall and the radiation being shielded by a water film covering the soil surface. This phenomenon is likely specific to the period shortly after the nuclear accident, as there had not been much time elapsed since the accident and there were numerous nuclear species originating from the accident present. Regarding the snow accumulation, the decrease shown in S2 was caused by a heavy snow accumulation of 41 cm recorded in Fukushima City on January 19, 2013, while S3 was caused by a snow accumulation of 37 cm on February 15, 2014. The temporary decrease in the counting rate lasted about 22 days for S2 and 29 days for S3, and this is considered a reasonable result. The results of S2 and S3 in Fig. 8, which are measurements aimed towards the outdoors, also show similar patterns. Additionally, even temporary decreases that are not noticeable in Fig. 6, represented by S3′ and similar decreases in Fig. 8, were observed, presumably because they are sensitive to outdoor conditions. After S3, it appears that the dose rate has decreased, which could indicate the possibility of a decontamination effect due to snowmelt. On the other hand, decontamination work was carried out artificially at FMU on October 8, 2014. The sharp decrease shown as a mark D in Fig. 8 is due to this work, indicating that decontamination is indeed effective in reducing environmental radiation. However, a significant decrease is not observed in the measurement results at the indoor center shown in Figs. 5, 6. In Fig. 6, an increase in the counting rate of unknown origin, as indicated by the marked ‘unexplained increase,’ was observed. It was also observed on August 2, 2018, as shown in Fig. 5. However, no increase was observed on the corresponding date in Fig. 9. The cause is highly likely to be human error, such as accidentally moving the radioactive source closer. In Fig. 9, several temporary decreases were observed in addition to the point indicated by S4, but the values of these decreases are not as significant as those seen in S1–S4 in Fig. 6. This is considered because the absolute values of the radiation dose rate have been decreasing.
Conclusion
The purpose of this research was to report the results of radiation measurements that have been conducted continuously since before the nuclear accident, predict future trends based on those results, and disseminate them to local residents. The measurements conducted continuously before the nuclear accident at the center of the laboratory showed that in the early stages, radiation from radioactive isotopes with short half-lives was dominant, while radiation from radioactive isotopes with longer half-lives became dominant as the measurement period became longer. Through nonlinear least squares regression, both short and long half-lives were successfully determined. In the future, it will also be possible to predict how the radiation dose will decrease. The environmental radiation trends around FMU were measured by the equipment installed near the window after the nuclear accident. It was found that environmental radiation is decreasing exponentially, and as a result, it became possible to predict future dose rates based on this trend. Both types of measurements were affected by rainfall and snow accumulation. Especially, the measurement near the window showed significant influence from decontamination work. Currently, it is possible to objectively disseminate information on the status of environmental radiation near FMU to local residents.