

Introduction
Radiation protection is of utmost importance in various fields due to the harmful effects of radiation. Shielding is considered the most effective method to reduce radiation exposure; however, it presents challenges when dealing with gamma radiation due to its high energy and penetration capabilities. Traditionally, lead has been used for radiation shielding due to its high atomic number [1]. However, due to its hazardous effects and cost, researchers are exploring alternative materials like glass, concrete, steel, and polymers. The selection of protective materials must take into account the radiation type and the mechanical and structural properties of the materials [2].
Smart polymers, also known as intelligent polymers, belong to a class of materials that exhibit reversible and significant changes in response to small variations in environmental conditions. These conditions include electric and magnetic fields, temperature, pH levels, light intensity, ionic factors, and mechanical stresses. These polymers possess the remarkable ability to undergo incremental changes triggered by external stimuli until a specific threshold is reached. Once the stimulus is removed, they can fully recover their original shape [3].
Among these smart polymers, polyvinylidene fluoride (PVDF) stands out as a notable example. PVDF is a specialized thermoplastic fluoropolymer known for its excellent resistance to solvents, acids, and hydrocarbons [4]. It is non-toxic, as confirmed by the U.S. Food and Drug Administration, and finds applications in various fields such as nuclear waste handling, chemical production, and boiler service pipes where exposure to high temperatures, hot acids, and radiation is common.
PVDF-based composites have garnered significant attention due to their exceptional properties, such as lightweight nature, thermal stability, ease of processing, affordability, excellent flexibility, and corrosion resistance [5]. These composites have proven highly effective in shielding against electromagnetic interference. Recent research conducted by Zakaly et al. [6] in 2023 demonstrated that the addition of nanoparticles of rare earth doped strontium barium titanate to PVDF has a profound impact on the optical, mechanical, and radiation shielding properties of the material. The study highlighted the nanocomposites’ effectiveness in shielding gamma radiation, suggesting their potential application as materials for radiation shielding [6].
Hence, PVDF displays promising characteristics for radiation shielding purposes, owing to its resistance properties and high-temperature thresholds. Furthermore, other researchers, such as Alabsy et al. [7], Sayyed et al. [8], and Silva et al. [9], have previously investigated the gamma-ray shielding of PVDF.
Various materials have specific shielding properties that are crucial to determine, such as the linear attenuation coefficient (LAC), mass attenuation coefficient (MAC), mean free path (MFP), and half-value layer (HVL). However, conducting experiments to obtain these properties can be challenging and prone to errors due to insufficient equipment, data processing mistakes, and interference from natural radioactivity. Fortunately, researchers have developed computational software and tools to simulate and calculate these shielding properties accurately. For example, the XCOM software (National Institute of Standards and Technology) [10] and Monte Carlo N-Particle Transport (MCNP) are widely used for theoretical calculations of attenuation coefficients [11, 12]. Additionally, user-friendly online software like Phy-X/Photon Shielding and Dosimetry (PSD) ( https://phy-x.net/module/physics/shielding) [13] and offline software like MRCsC [14, 15] and EpiXS [16, 17] have been introduced for calculating photon shielding and dosimetry, as well as predicting LACs against fast neutrons from specific sources. These advancements have greatly facilitated the determination of shielding properties without relying solely on experimental procedures.
While past works inadequately investigated the impact of adding Tungsten to PVDF, this study focuses on the effects of adding tungsten carbide (WC), tungsten trioxide (WO3), and tungsten disulfide (WS2) at varying concentrations on the gamma-neutron shielding effectiveness of PVDF. The evaluation of shielding effectiveness involved the utilization of EpiXS, Phy-X, and MCNP simulation tools.
Materials and Methods
The investigation thoroughly assessed the effect of mixing WC, WO3, and WS2 chemical compounds on the radiation shielding properties of PVDF with compositions of C2H2F2. The study employed computational tools, including EpiXS, Phy-X/PSD, and MCNP5. PVDF was mixed with WC, WO3, and WS2 chemical compounds according to the following: PVDF–xWC, PVDF–xWO3, and PVDF–xWS2, where (x=0%, 5%, 10%, 15%, and 20%). The influence of each compound on the radiation shielding properties of PVDF was investigated individually, employing consistent graduated mixing rates. Table 1 illustrates the weight fraction and densities of the mixtures for each additive. Phy-X/PSD software was used to calculate the following parameters: MAC, LAC, and fast neutron effective removal cross-section (∑R). MAC describes the effectiveness of a material to absorb radiation and is dependent on the density of the sample and the energy of the incoming photons. The LAC is derived by multiplying the MAC with the density of the material. While the LAC and MAC have similarities, the key difference lies in the fact that density is taken into account when calculating the LAC. Other values can be obtained from these two parameters, such as the HVL, which represents the thickness required for a material to reduce the intensity of incoming radiation in half, and the MFP, which is the average distance traveled by a photon in the medium before an interaction takes place. Thus, all the above parameters were simulated in the continuous standard energy region (0.001 to 15,000 MeV). Besides gamma radiation, the neutron is also taken into account. Therefore, the ∑R has been simulated using Phy-X/PSD software. The ∑R is defined as the probability of a fast neutron undergoing its first collision with the nucleus of an interactive medium.
The following equations represent the shielding parameters’ basic relations. When a material of thickness X is placed in the way of a radiant gamma beam, the intensity of this beam is attenuated according to Beer Lambert’s law:
where I0 and I are the intensity of incident and transmitted gamma radiation, respectively, X and ρ are the thickness and density of the samples, respectively, and μmass is the MAC (cm2/g). The MAC is calculated using Equation (2) as follows:
The ratio of the intensity of the transmitted gamma radiation to the intensity of the incident gamma radiation is called the gamma transmission factor (GTF).
The mixture rule gives the MAC for multi-element materials and is given in Equation (3) where wi is the weight fraction of the i th element. As shown, μmass for a multi-element medium is a linear combination of the (μmass)i of its constituent elements.
The HVL and MFP can be calculated using the following expressions:
The fast neutrons macroscopic effective removal cross-section (∑R) can be calculated for various elements in the compounds or mixtures using the following equation:
where Wi is the partial density (g/cm3) and
Σ R ρ ( cm 2 / g )
where the wi is the weight fraction of the i constituent and ρs is the density of the sample.
The equations provided in Equation (8) to Equation (10) apply only to elements with certain atomic numbers (A) and atomic masses (Z), and they do not apply to hydrogen (Z=1) [21]. However, the ∑R for hydrogen can be calculated using the following formula [22]:
where σi is the microscopic cross-section (barns) and the
( Σ R ρ ) i
Here, NA represents Avogadro’s number. To obtain the value of σi for hydrogen, the microscopic cross-section database XSPlot (available at: https://isotope-xs-plotter-4zf6u4tg6a-lz.a.run.app/) was used.
To validate the obtained results, the Windows-based application fast software EpiXS, based on EPICS2017 of ENDF/B-VIII and EPDL97 of ENDF/B-VI.8 photo atomic libraries [16, 17], was used for MAC calculations.
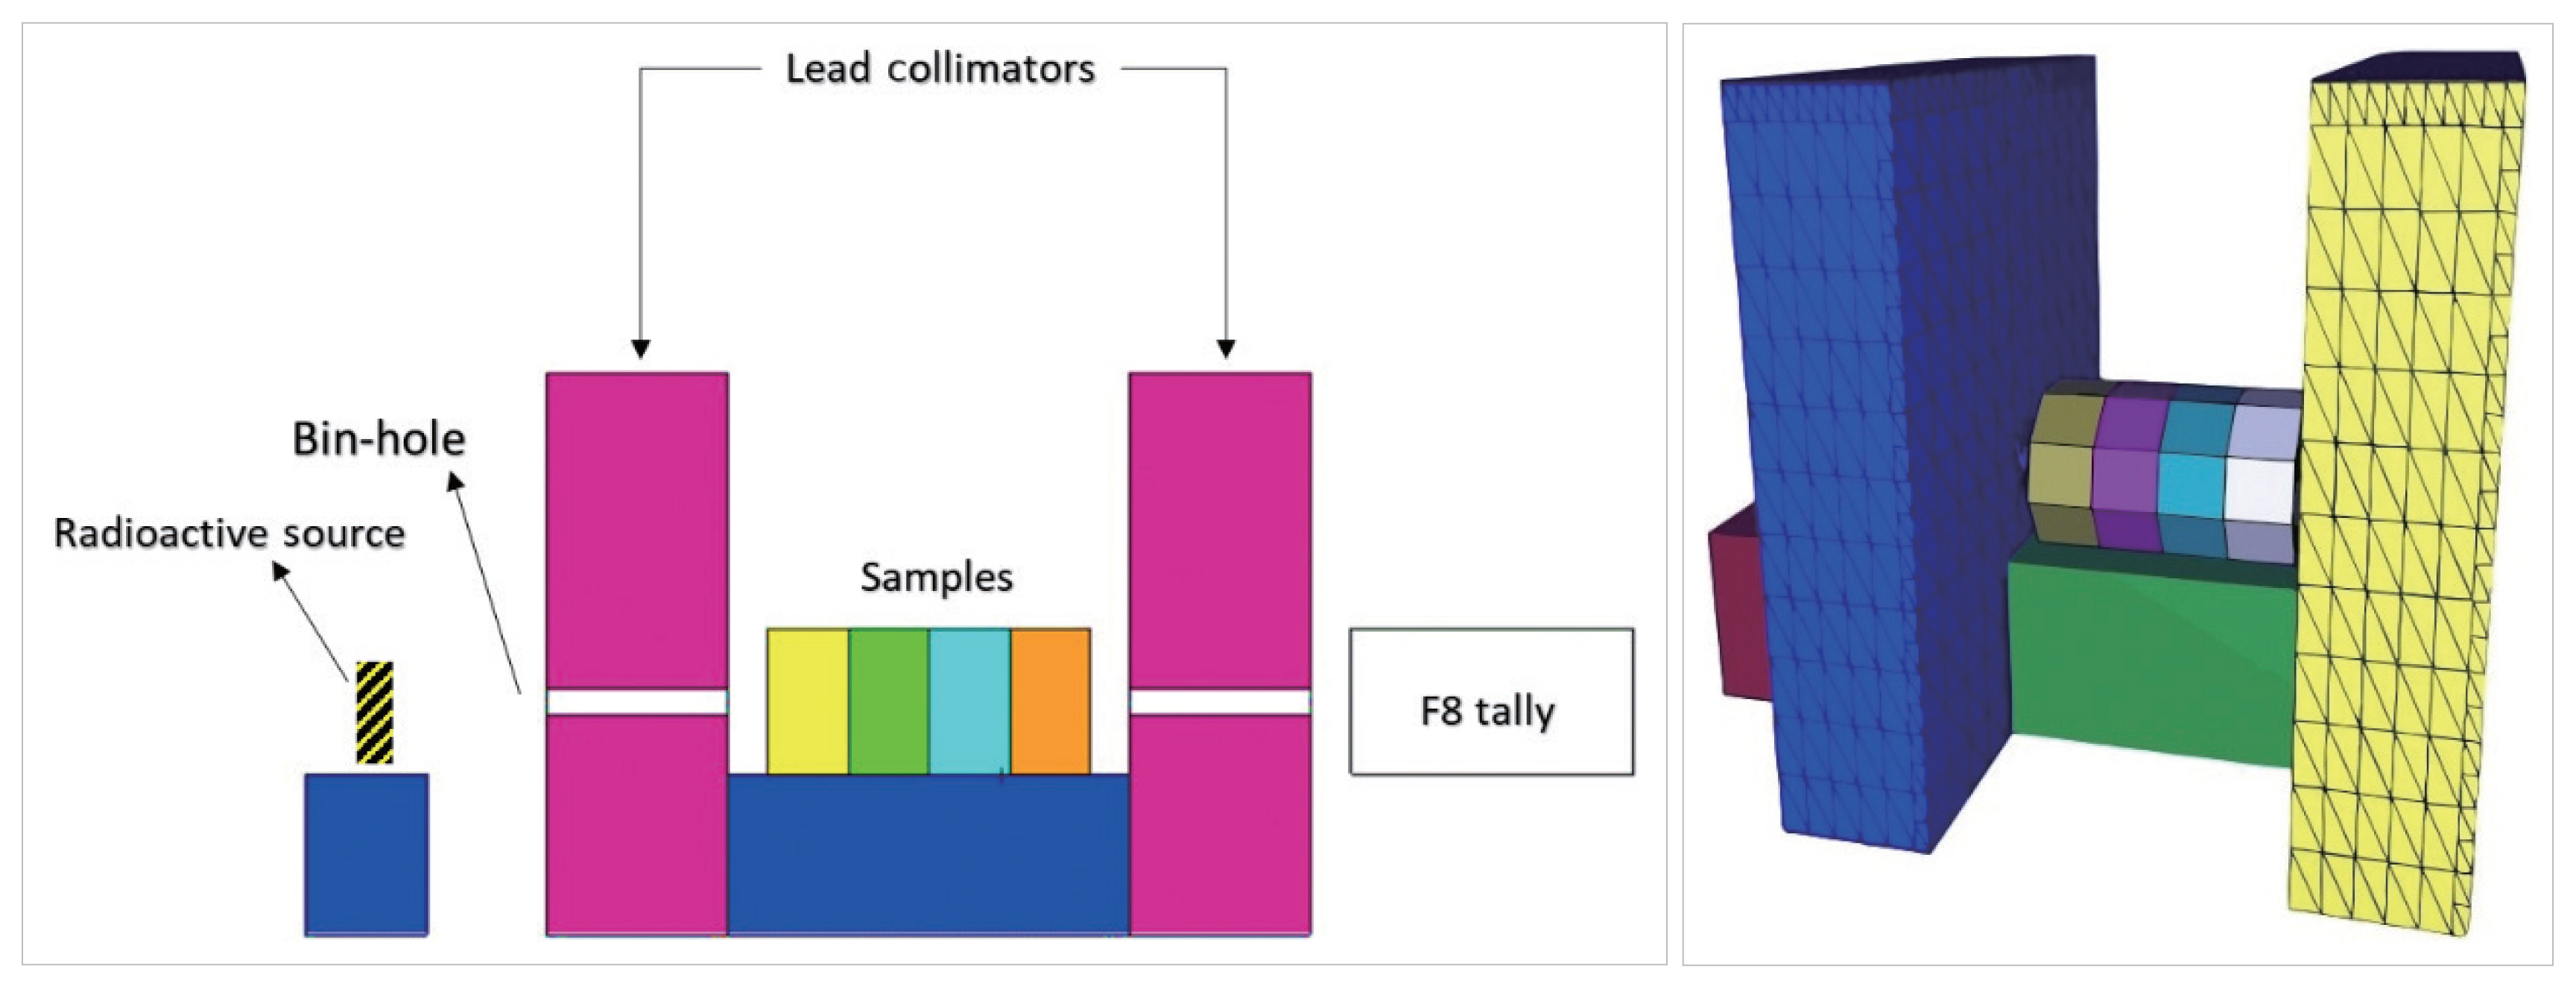
To evaluate the material’s efficacy in shielding against gamma radiation, the MCNP5 program was employed to compute the GTF and dose rate (mSv/hr). This analysis was specifically performed for pure PVDF and PVDF–xWC (where x=5% to 20%, with an increment of 5%), enabling a direct comparison of their shielding capabilities. The material was considered as a multilayer structure for the analysis. The process began by preparing the input file using a three-dimensional visual tool called VisED (Los Alamos National Laboratory), following a systematic approach. The first step involved determining the surfaces and cells to represent the dimensions and geometry of the study case, as shown in Fig. 1. The geometry consisted of two lead collimators measuring 21 cm×18 cm×4.5 cm, each with holes along the same line having a diameter of 1 cm. These collimators were designed to direct the radiation and prevent scattering. Additionally, two wood holders were included to support the radiation source, and four layers of sample disks were placed in each case. A cylindrical cell, F8 tally, was used to capture the energy distribution of pulses generated in a detector by the radiation. Subsequently, the elemental compositions were determined for each layer, which served as input for the material cards, along with the corresponding densities. Once the surfaces, cells, and material cards were defined, the cells were filled with the respective materials and their densities. The radiation source was defined as a monoenergetic point photon source located 21 cm away from the F8 tally cell and aligned with the holes. It had an energy of 0.662 MeV and an activity of 1×10⁸ disintegrations per second. The simulation was executed nine times to obtain GTF, both before and after incorporating the four layers of pure PVDF samples and four layers only of PVDF–0.20WC, to observe the cumulative GTF after adding each layer. The uncertainties obtained from MCNP5 were found to be less than 4%, indicating the reliability of the results. The tally F4 and the flux-to-dose rate conversion factor sets are for use on the DE and DF tally cards to convert from calculated particle flux to the dose equivalent rate. The dose equivalent rate was obtained before utilizing the samples and after the S5 samples in both cases of pure PVDF and PVDF–xWC.
Results and Discussion
1. Mass Attenuation Coefficient
The radiation MAC for PVDF samples with different weight fraction of WC, WO3, and WS2 were calculated using Phy-X/PSD and EpiXS simulations at energies of 0.0595, 0.662, and 1.333 MeV. The results are presented in Table 2, where S1 represents the pure PVDF samples and S2, S3, S4, and S5 refer to the additive rates of WC, WO3, and WS2, respectively, at 5%, 10%, 15%, and 20%. The MAC values obtained by the Phy-X/PSD and EpiXS simulations show good agreement, and the relative percentage difference (RPD%) was calculated using the following formula:
The obtained results demonstrate that the maximum RPD% for MAC calculations at 0.0595, 0.662, and 1.333 MeV for all samples with WC additives are 1.31%, 0.25%, and 0.36%, respectively. Furthermore, for samples with WO3 additives, the maximum RPD% values were found to be 1.26%, 0.26%, and 0.36% at the respective energy levels. Similarly, in the case of samples with WS2 additives, the maximum RPD% values were observed to be 1.20%, 0.25%, and 0.18% for the corresponding energies.
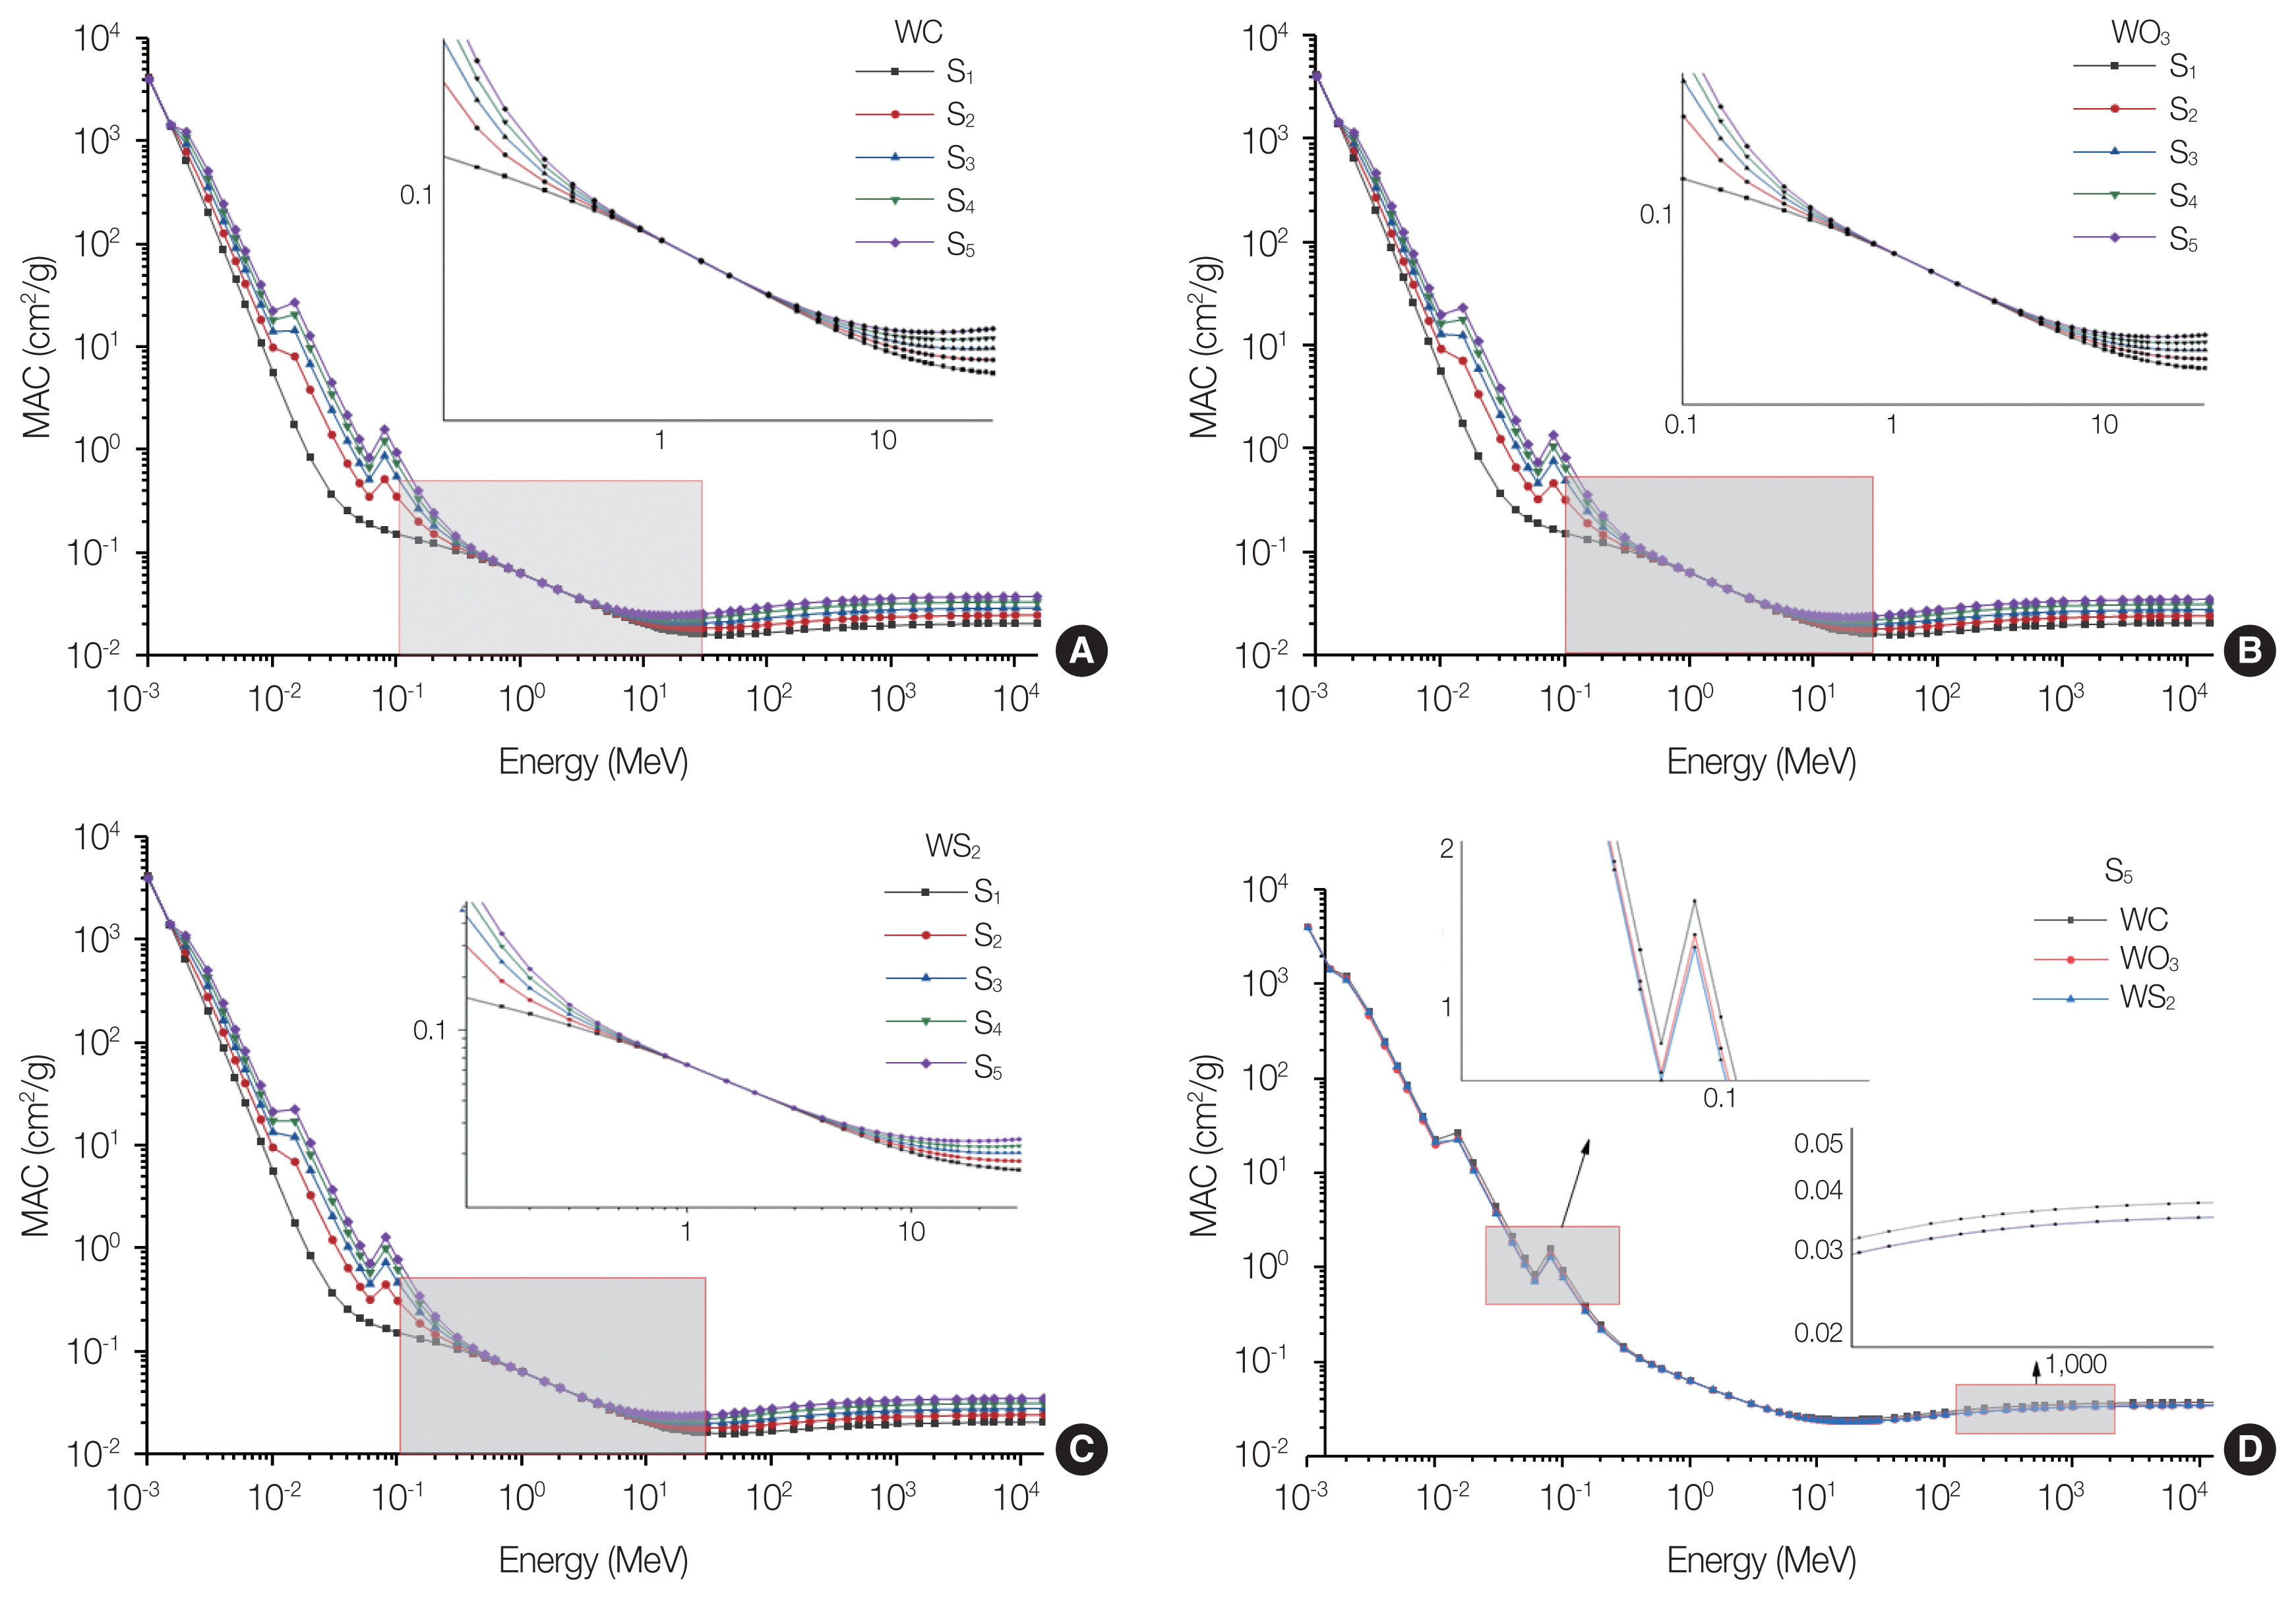
Table 2 presents the calculated MAC for PVDF samples with different concentrations of WC, WO3, and WS2 as a function of photon energy. Overall, it was observed that the MAC decreases as the photon energy increases. Additionally, higher concentrations of WC, WO3, and WS2 in PVDF samples led to increased MAC values at 0.0595 and 0.662 MeV. The percentage changes were calculated relative to the MAC value of the pure PVDF sample, using the following formula:
where Sx is the additive rates concentration rate of samples from S2 to S5 based on Table 1. The percentage changes results of MAC values at 0.0595 MeV for WC additive rates were significant, ranging from 88.46% to 353.907% for concentrations of 5% to 20%. Similarly, the percentage changes in MAC values at 0.662 MeV for WC additive rates ranged from 1.29% to 5.05%. The percentage changes in MAC values at 1.333 MeV for WC were negative, ranging from −0.18% to −0.54% (Fig. 2A). For WO3, the percentage changes in MAC values at 0.0595 MeV varied from 74.77% to 299.05%, while the change at 0.662 MeV ranged from 1.16% to 4.27%. The percentage changes in MAC values at 1.333 MeV for WO3 were negative, ranging from −0.18% to −0.54% (Fig. 2B). Regarding WS2, the percentage changes in MAC values at 0.0595 MeV were between 71.42% and 285.58%, while at 0.662 MeV they ranged from 1.03% to 4.01%. The percentage changes at 1.333 MeV were negative, with values between −0.18% and −0.36% (Fig. 2C). Based on the results, it is evident that mixing WC, WO3, and WS2 with PVDF leads to an increase in MAC values at 0.0595 and 0.662 MeV, indicating improved radiation shielding properties (Fig. 2D). However, at 1.333 MeV, the MAC values decrease with increasing WC, WO3, and WS2 concentrations. Comparing the percentage changes, it can be observed that the MAC values in PVDF mixed with WC show higher increases compared to WO3 and WS2. This suggests that PVDF mixed with WC exhibits the best radiation shielding properties among the three additives. For enhanced shielding effectiveness, increasing the content of WO3 and WS2 in the PVDF mixture would be necessary.
The simulated results obtained using the Phy-X/PSD software for MAC have been presented in Fig. 3. The graph illustrates the variation of MAC concerning gamma-ray energies ranging from 0.001 to 15,000 MeV. Fig. 3 demonstrates a notable trend in the distribution of the MAC as the gamma-ray energies increase. However, this behavior exhibits variation across different energy ranges. In the low gamma-ray energies (0.0015 MeV<Energy (E)<1 MeV), the MAC demonstrates a sharp and smooth decrease. Within the intermediate energy region (1 MeV<E<3 MeV), it was observed a similar decreasing trend in the MAC values for all samples. This trend leads to a convergence of the MAC values within this energy range. The primary factor contributing to this convergence is Compton scattering [24], which is prominently depicted in the zoomed region of Fig. 3A–3C. Importantly, this phenomenon of Compton scattering explains the previously observed negative percentage change of the MAC at 1.333 MeV. At this specific energy, the influence of Compton scattering becomes dominant, leading to a decrease in the MAC values. Remarkably, at high energies, the MAC remains nearly constant. These distinct patterns arise from the diverse mechanisms involved in gamma-ray absorption within each energy range. Furthermore, Fig. 3D reveals that among all cases, the addition of 20% WC to the PVDF sample yields the highest MAC value. This observation highlights the impact of incorporating WC in the PVDF sample on enhancing the MAC.
2. Mean Free Path
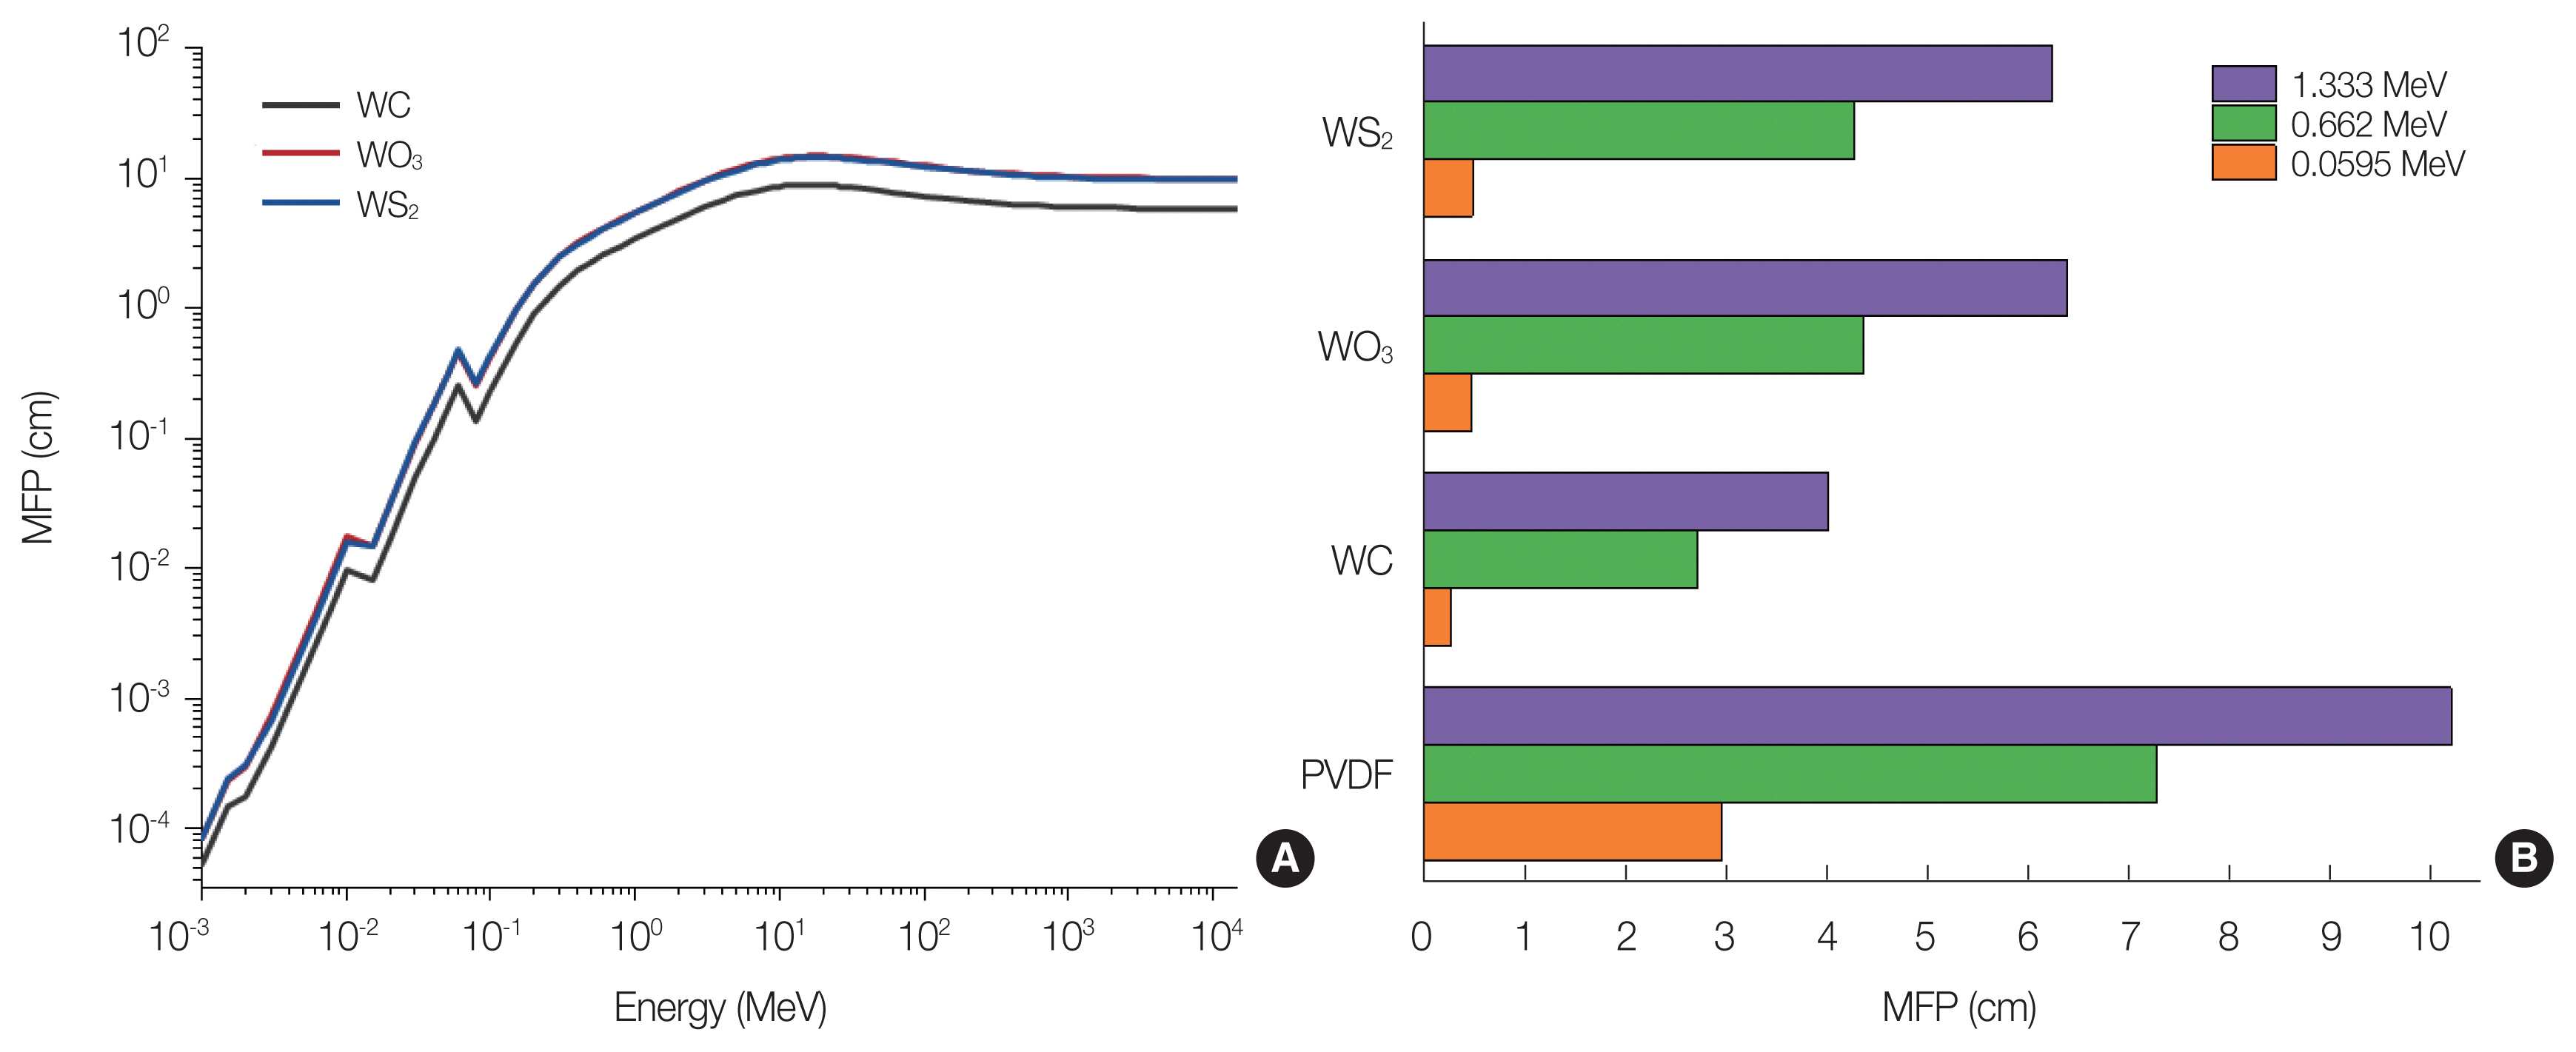
Fig. 4 presents the determination of MFP values across a photon energy range spanning from 0.001 to 15,000 MeV. Specifically, Fig. 4A illustrates the MFP values for the entire energy range. Additionally, in Fig. 4B, a closer examination of the MFP values at three specific photon energy points (0.0595, 0.662, and 1.333 MeV) is provided. These energy points were selected for detailed analysis to highlight the MFP behavior at distinct energy levels. MFP serves as a measure of the average distance between successive collisions, with lower values indicating a more effective shielding capability. Based on the observations in Fig. 4A, it is evident that the PVDF–0.20WC sample exhibits the lowest MFP compared to the PVDF–0.20WO3 and PVDF–0.20WS2 samples, signifying enhanced shielding properties. Fig. 4B specifically highlights the MFP values at these energy points. Among the four studied samples, PVDF–0.20WC consistently demonstrates the lowest MFP values, measuring 0.2539, 2.7101, and 4.0113 cm at these respective energy levels. PVDF–0.20WO3 shows the second-lowest MFP only at 0.0595 MeV, while PVDF–0.20WS2 exhibits the second-lowest MFP values solely at 0.662 and 1.333 MeV. Notably, in the case of PVDF–0.20WC, the MFP undergoes a percentage change at the selected energy points. It decreases to 91.38% at 0.0595 MeV, 62.74% at 0.662 MeV, and 60.66% at 1.333 MeV, indicating a substantial reduction in the average collision distance and highlighting the improved shielding efficiency of the PVDF–0.20WC sample.
3. Effective Atomic Number
The effective atomic number (Zeff) was determined for the PVDF samples, as shown in Fig. 5, serving as a measure of the average atomic number and indicating the shielding capability of the compounds or mixtures. Fig. 5 graphically presents the variation of Zeff concerning photon energy at a range of 0.001 to 15,000 MeV for the PVDF–0.20WC, PVDF–0.20WO3, and PVDF–0.20WS2 samples. The Zeff values at energy points of 0.0595, 0.662, and 1.333 MeV were specifically examined and compared to the initial value of the pure PVDF sample (Fig. 5B). Remarkably, significant percentage changes in Zeff were observed at the specified energy points of 0.0595, 0.662, and 1.333 MeV for each mixture. For PVDF–0.20WC, the percentage changes in Zeff were 315.17%, 26.80%, and 20.69%, respectively. Similarly, for PVDF–0.20WO3, the percentage changes in Zeff were 273.66%, 23.77%, and 18.68%. Furthermore, for PVDF–0.20WS2, the percentage increases in Zeff were 262.92%, 25.13%, and 20.31%. Based on the aforementioned findings, it is evident that the PVDF–0.20WC sample exhibits the highest radiation shielding potential among the PVDF mixtures with different additives, namely PVDF–0.20WO3 and PVDF–0.20WS2. This implies that the inclusion of WC in the PVDF matrix results in enhanced shielding properties than those obtained with WO3 and WS2. Furthermore, it is worth noting that the percentage increase in Zeff values for the PVDF–0.20WS2 composite is slightly higher than that of the PVDF–0.20WO3 sample, only at energy points of 0.662 and 1.333 MeV. This indicates that, specifically at these energy levels, PVDF–0.20WS2 offers a marginally greater improvement in radiation shielding effectiveness compared to PVDF–0.20WO3.
4. The Fast Neutrons Macroscopic Effective Removal Cross-Section
The simulation of ∑R was conducted using the Phy-X/PSD program. ∑R provides insights into the neutron shielding properties, which are essential in addition to gamma radiation. The calculated values of ∑R were plotted as a function of the weight fraction of additives in PVDF samples, and the results are presented in Fig. 6A–6C.
In general, Fig. 6 illustrates the influence of the weight fraction of additives on the neutron shielding properties of the PVDF samples. A remarkable observation is the strong linear correlation (R2>0.99) between the weight fraction in the mixtures and the neutron shielding properties. Generally, an increase in ∑R is observed with increasing weight fraction of PVDF–xWC, PVDF–xWO3, and PVDF–xWS2 samples. Significantly, PVDF–0.20WC exhibits the highest ∑R value of 0.23 cm−1, showing a percentage change of 116.09% compared to the pure PVDF sample. On the other hand, the PVDF–0.20WS2 sample demonstrates the lowest ∑R value of 0.15 cm−1 among all the samples (Fig. 6D).
In addition, in Fig. 6D, it was found that the MFP of the fast neutrons (
M F P = 1 Σ R
In addition to the simulation using Phy-X/PSD software, the calculation of ∑R was performed, specifically for the PVDF–xWC samples, utilizing Equation (6) to provide a means of validation for the simulation results. The calculated results demonstrate good agreement with the simulated values. The RPD% between the calculated and simulated ∑R values are presented in Table 3.
5. The Dose Equivalent Rate and Gamma Transmission Factor
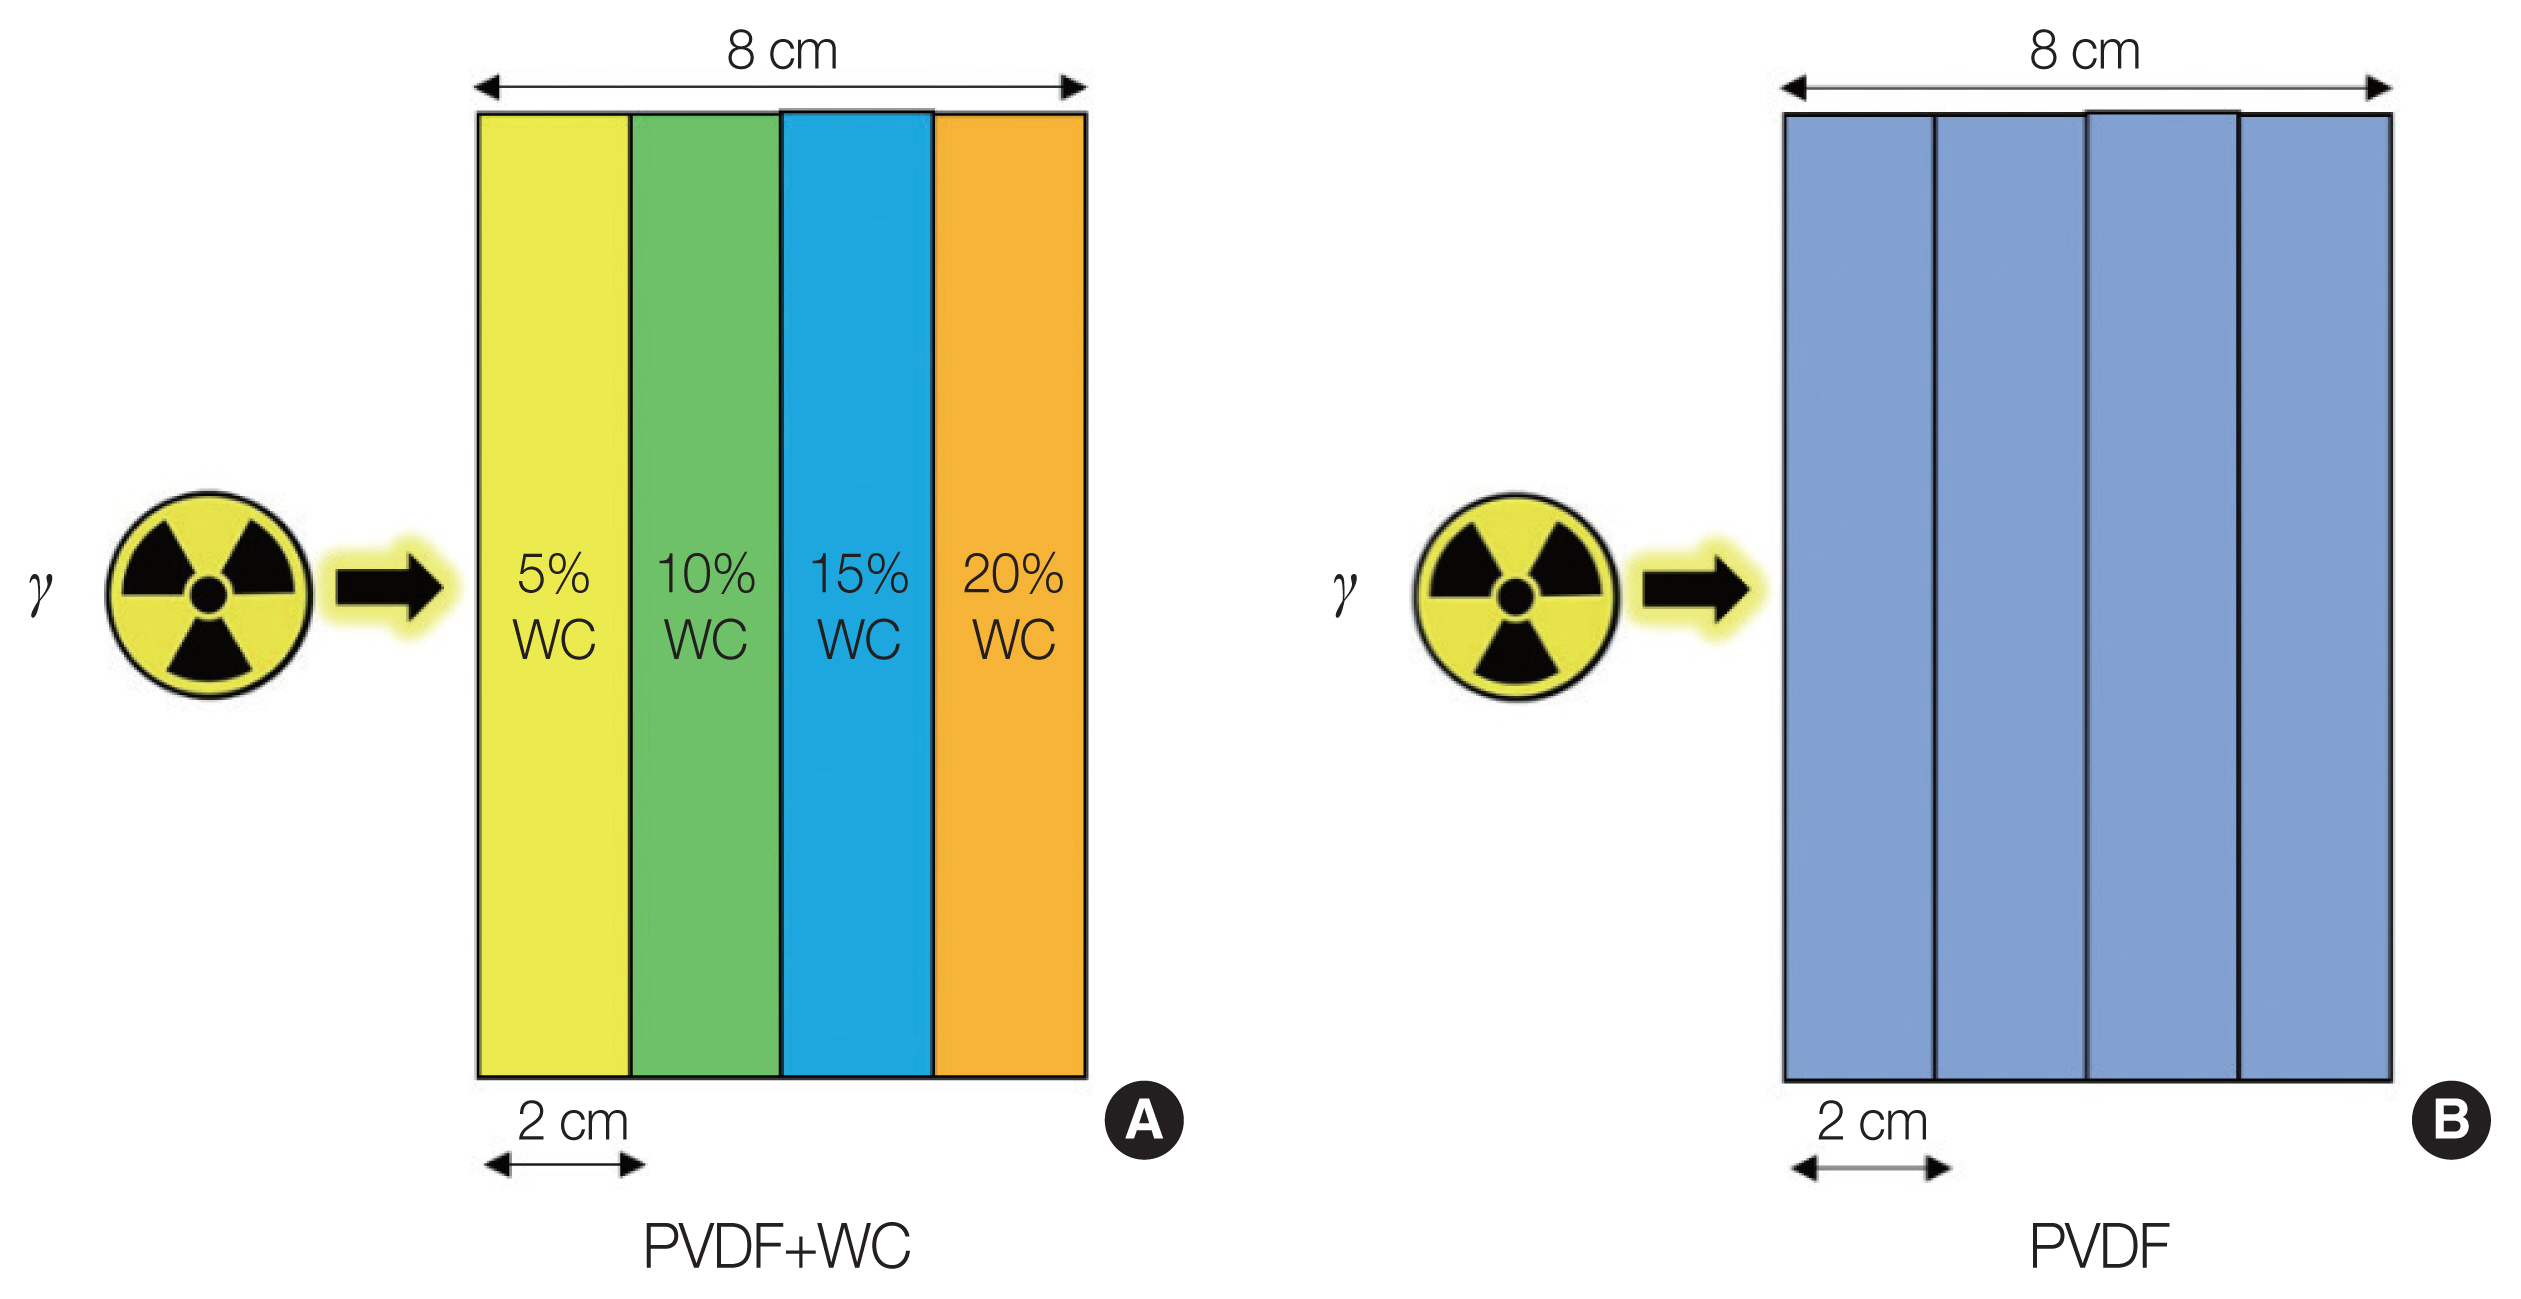
The evaluation of the samples was performed using MCNP5, which allowed for the determination of the energy distribution of radiation pulses in a detector before and after adding the layers of pure PVDF and PVDF–xWC, as illustrated in Fig. 7. The samples of PVDF–xWC were systematically arranged based on their weight fraction.
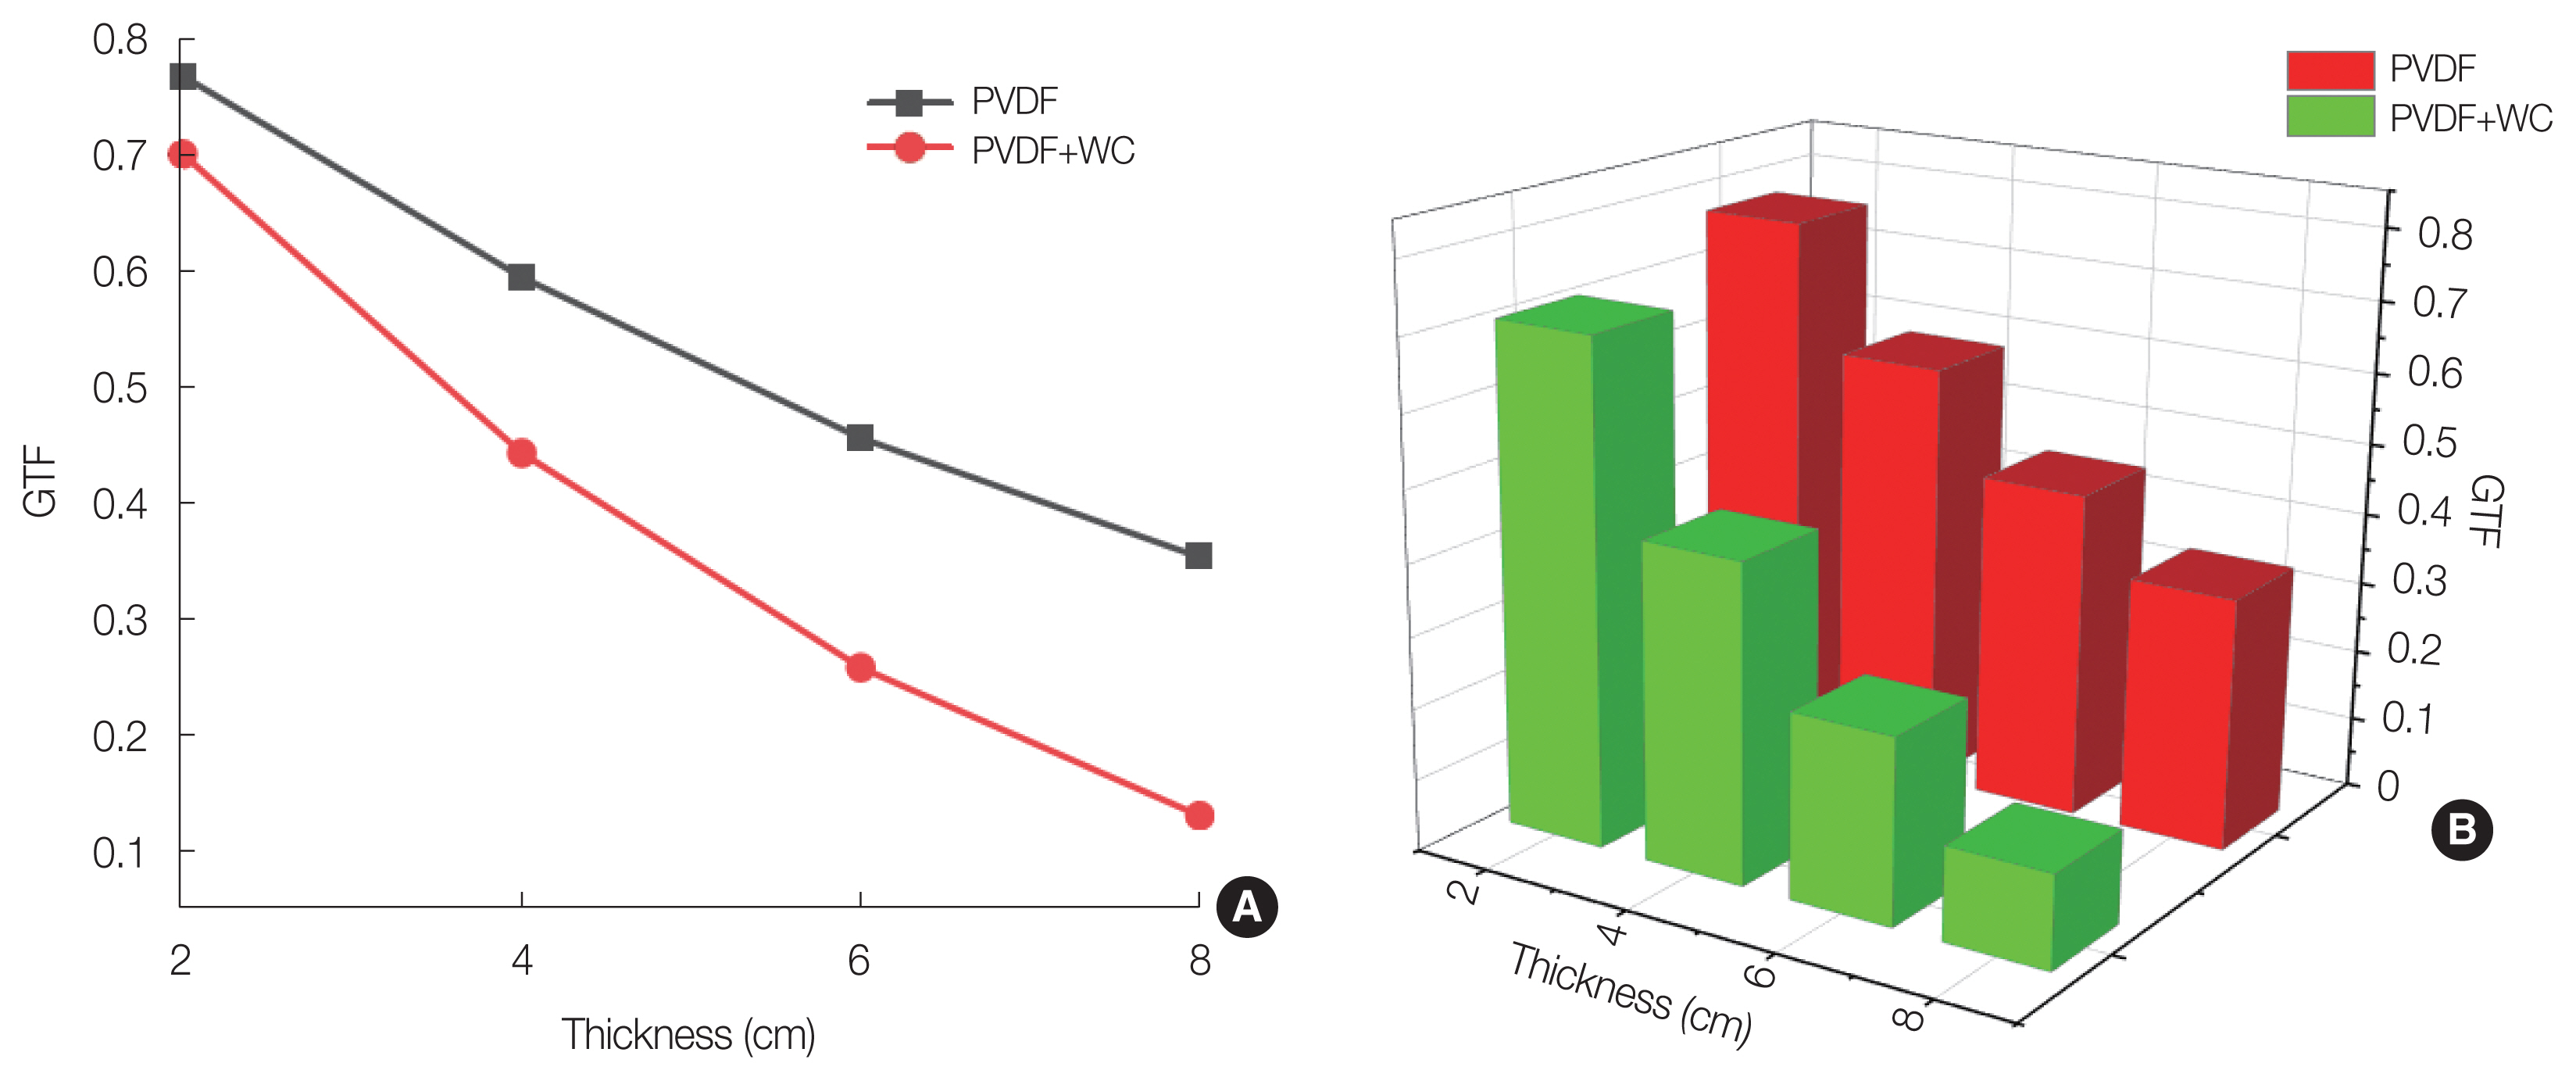
The GTF at the end of each layer was obtained for both pure PVDF and PVDF–xWC, and their values are presented in Fig. 8. For the pure PVDF layers, the GTF values were found to be 0.77, 0.60, 0.46, and 0.35 for thicknesses of 2, 4, 6, and 8 cm, respectively. In the case of PVDF–xWC, the GTF values were 0.70, 0.44, 0.26, and 0.13 for the same thicknesses. The GTF values indicate that PVDF–xWC exhibits higher attenuation of gamma radiation compared to the pure PVDF layers, consequently, PVDF–xWC is more effective in inhibiting the passage of gamma radiation.
In terms of the dose equivalent rate, the results indicated a decrease from 0.0127 mSv/hr for pure PVDF to 0.0044 mSv/hr and a further decrease to 0.0016 mSv/hr for the PVDF–xWC samples. These results indicate a further reduction in the dose equivalent rate achieved by incorporating PVDF–xWC, demonstrating its enhanced efficiency in shielding against gamma radiation.
Conclusion
In this research study, the Phy-X/PSD software was employed to calculate various important parameters including the MAC, HVL, MFP, Zeff, and ∑R. The MAC calculations were carried out for PVDF–xWC, PVDF–xWO3, and PVDF–xWS2 samples, where x represents the weight fraction ranging from 0% to 20%, with an increment of 5%. Subsequently, additional analyses were conducted exclusively on PVDF–0.20WC, PVDF–0.20WO3, and PVDF–0.20WS2 samples to determine their HVL, MFP, Zeff, and ∑R. The energy range considered for the calculations spanned from 0.001 to 15,000 MeV. To ensure the accuracy and reliability of the results obtained from Phy-X/PSD, EpiXS simulations were conducted as a validation method. The simulations specifically targeted energies of 0.0595, 0.662, and 1.333 MeV. Comparing the MAC values obtained from the simulations with those derived from the Phy-X/PSD calculations, a good agreement was observed, where the maximum RPD does not exceed 1.5%. The results of the study indicate that as the weight fraction of WC, WO3, and WS2 increase in PVDF, there is a corresponding increase in the MAC values. This increase in MAC values suggests an improvement in the radiation shielding properties of the PVDF samples. Notably, the percentage change in the MAC values of PVDF–xWC shows higher increases compared to those of PVDF–xWO3 and PVDF–xWS2. Based on these findings, it can be concluded that PVDF mixed with WC demonstrates the most effective radiation shielding properties among the studied additives. MFP results provide additional insights into the shielding properties of the mixture materials. In the case of the PVDF–0.20WC sample, the MFP values were found to be the lowest among the studied samples. This indicates that PVDF–0.20WC has enhanced shielding properties compared to PVDF–0.20WO3 and PVDF–0.20WS2. However, it’s worth noting that the PVDF–0.20WO3 sample exhibited the second-lowest MFP value only at an energy of 0.0595 MeV. Similarly, the PVDF–0.20WS2 sample showed the second-lowest MFP values specifically at energies of 0.662 and 1.333 MeV. The Zeff results indicate that the PVDF–0.20WC sample exhibits the highest values among the studied samples. Additionally, the percentage increase in Zeff values for the PVDF–0.20WS2 sample is slightly higher than that of the PVDF–0.20WO3 sample, specifically at energy points of 0.662 and 1.333 MeV. This suggests that, at these particular energy levels, PVDF–0.20WS2 offers a slightly greater improvement in radiation shielding effectiveness compared to PVDF–0.20WO3. The ∑R was calculated using Equation (6), specifically for the PVDF–xWC samples, to provide additional validation for the simulation results. The calculated results demonstrated good agreement with the results obtained from the Phy-X/PSD software. In general, there exists a strong linear correlation between the weight fraction in the mixtures and the neutron shielding properties. As the weight fraction of PVDF–xWC, PVDF–xWO3, and PVDF–xWS2 samples increases, there is an observed increase in ∑R. Significantly, out of all the materials, the PVDF–0.20WC demonstrated the highest ∑R value, making it the most efficient material for shielding against fast neutrons. Conversely, the PVDF–0.20WS2 sample demonstrated the lowest ∑R value among all the samples, indicating relatively lower neutron shielding capabilities compared to the other samples. The simulation of the GTF and dose equivalent rate for the multilayered materials consisting of PVDF–xWC and pure PVDF was carried out using MCNP5. The GTF values obtained from the simulation indicate that PVDF–xWC exhibits higher attenuation of gamma radiation compared to the pure PVDF layers. Furthermore, the dose equivalent rate was observed to decrease when PVDF–xWC was incorporated into the multilayered material. Specifically, the dose equivalent rate decreased from 0.0127 to 0.0044 mSv/hr for pure PVDF and to 0.0016 mSv/hr for PVDF–xWC. These results indicate a significant reduction in the dose equivalent rate achieved by using PVDF–xWC, highlighting its improved efficiency in shielding against gamma radiation. The upcoming plans include using MCNP simulations to investigate cobalt-60 scattering and californium-252 secondary gamma of radioactive sources utilizing in Jordan Atomic Energy Commission’s secondary calibration labs. Furthermore, there’s a plan to produce samples for experimental validation, enabling a comparison between experimental and simulation results.